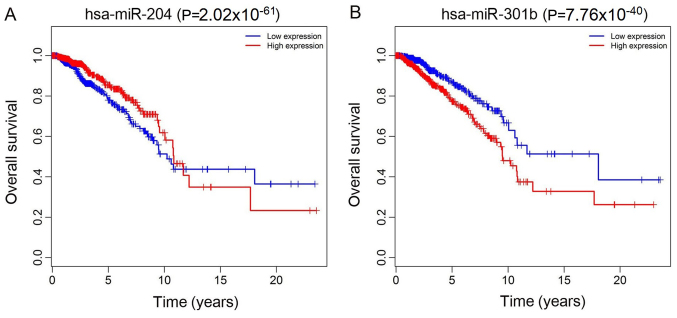
Figure 6.
Kaplan-Meier survival curves for two differentially expressed miRNAs associated with overall survival in breast cancer. (A) hsa-miR-204 (P=2.02×10−61) and (B) hsa-miR-301b (P=7.76×10−40). The x-axis represents overall survival time (years) and the y-axis represents survival function. hsa, Homo sapiens; miRNA, microRNA.

