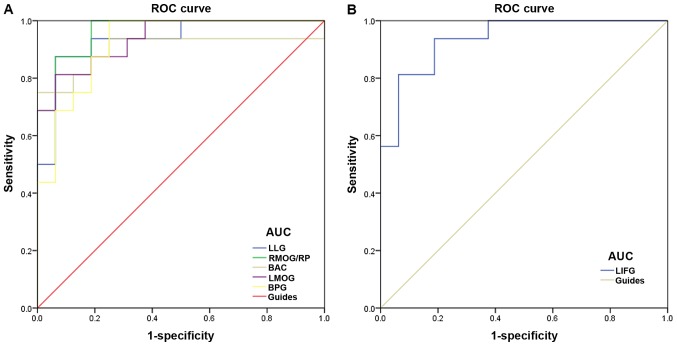
Figure 3.
ROC curve analysis of the ReHo values for altered brain regions in the SA group. (A) The area under the ROC curve was 0.934 for LLG (P<0.001; 95% CI, 0.847–1.000), 0.965 for RMOG/RP (P<0.001; 95% CI, 0.911–1.000), 0.902 for BAC (P<0.001; 95% CI, 0.777–1.000), 0.938 for LMOG (P<0.001; 95% CI, 0.860–1.000) and 0.922 for BPG (P<0.001; 95% CI, 0.830–1.000). (B) Area under the ROC curve for LIFG was 0.938 (P<0.001; 95% CI: 0.859–1.000). ROC, receiver operating characteristic; ReHo, regional homogeneity; SA, strabismus and amblyopia; LLG, left lingual gyrus; RMOG, right middle occipital gyrus; RP, right precuneus; BAC, bilateral anterior cingulate; LMOG, left middle occipital gyrus; BPG, bilateral precentral gyrus; LIFG, left inferior temporal gyrus.

