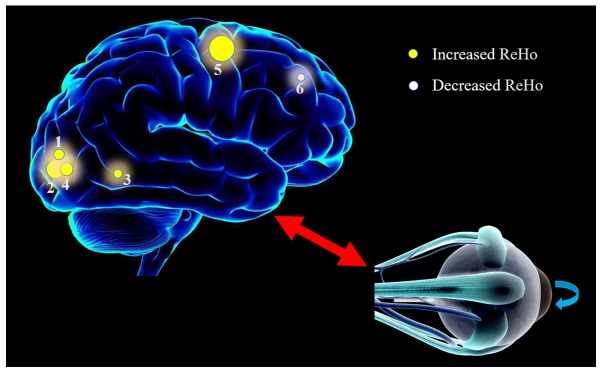
Figure 4.
ReHo results of brain activity in the SA group. Compared with the healthy controls, the ReHo values of regions 1–5 in SA patients were increased to various extents, while the value of region 6 was decreased. Region 1 refers the left lingual gyrus (BA 19; t=3.6987), region 2 to the right middle occipital gyrus/right precuneus (BA19; t=4.7141), region 3 to the bilateral anterior cingulate (t=3.8637), region 4 to the left middle occipital gyrus (BA 19; t=4.5112), region 5 to the bilateral precentral gyrus (BA 6; t=5.5492) and region 6 to left inferior frontal gyrus (BA9; t=−4.0693). The size of the spots denotes the degree of quantitative change. ReHo, regional homogeneity; SA, strabismus and amblyopia; BA, Brodmann area.

