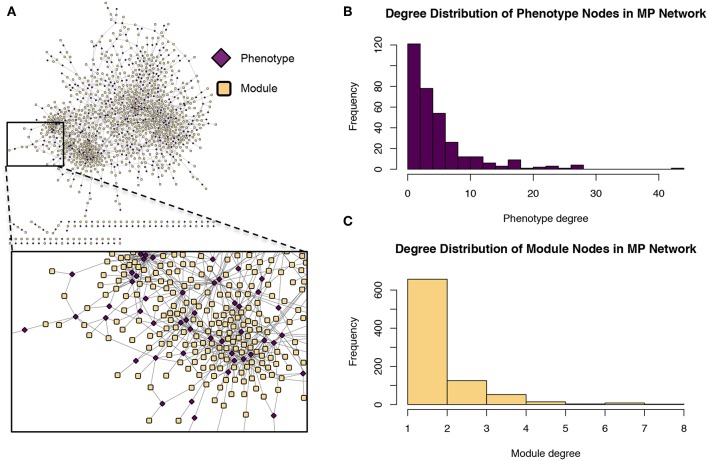
Figure 9.
Module-phenotype (MP) network. (A) The MP network. Yellow nodes represent association modules and pink nodes represent phenotypes. A module node is connected to a phenotype node if the phenotype is associated with all SNPs within the module and is thus considered a driving phenotype of the module. (B) Degree distribution of the phenotype (pink) nodes in the MP network. (C) Degree distribution of the module (yellow) nodes in the MP network.

