Figure 4.
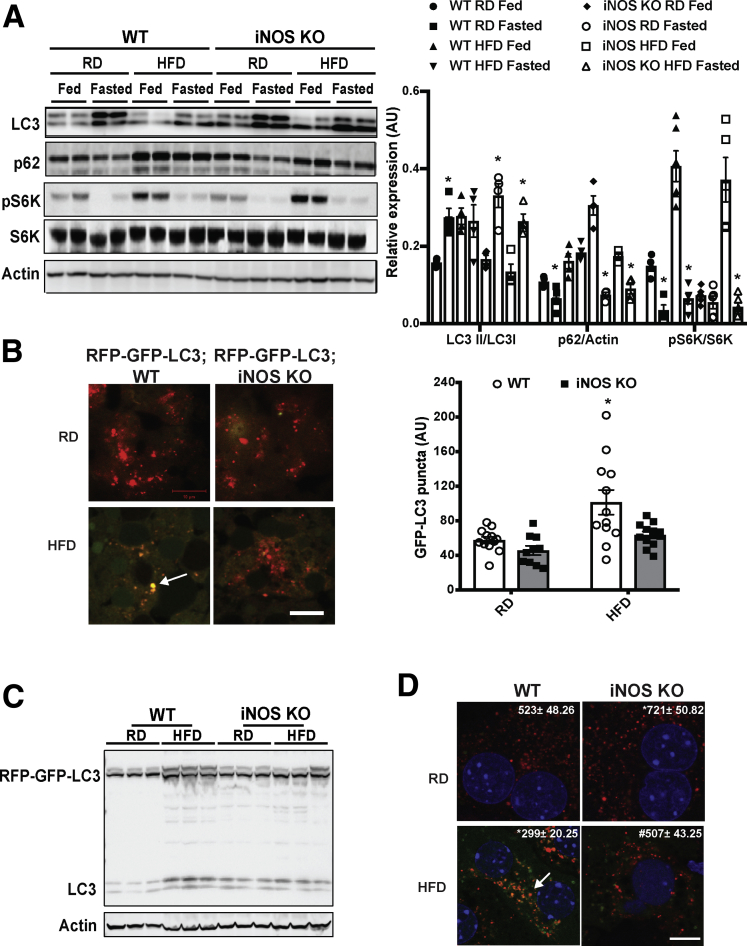
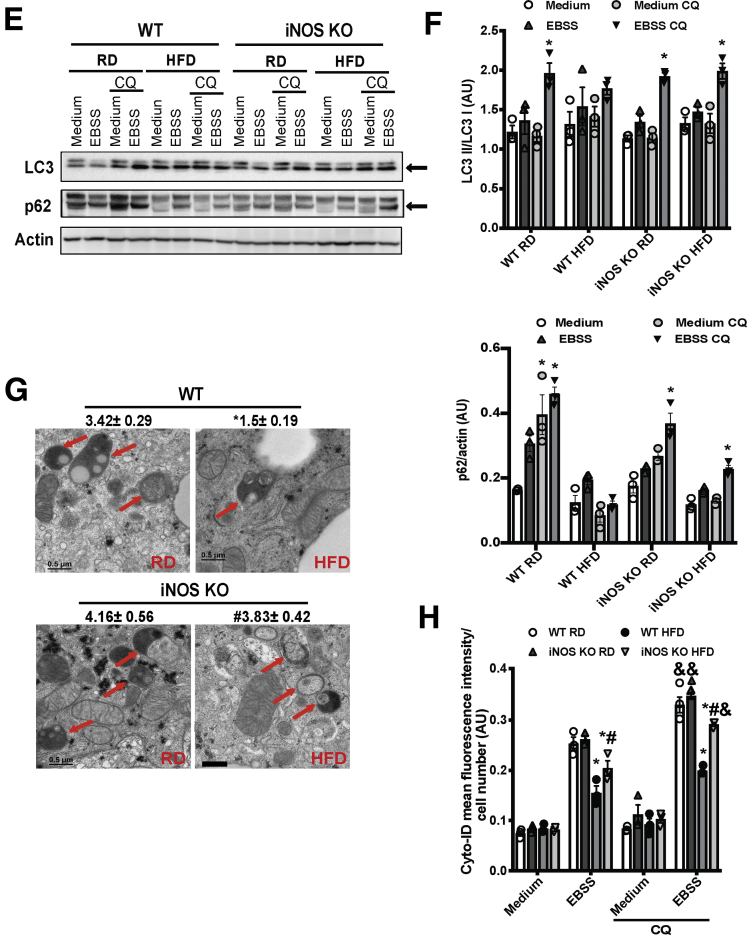
iNOS suppresses hepatic autophagy. (A) Representative Western blots of LC3 conversion, p62 and S6K (T421/S424) phosphorylation in livers from WT and iNOS-KO mice under fed or fasting (16 hours) conditions. Densitometry of Western blot analysis in A is shown on the right of the panel. *indicates statistical significance between fasting and fed in the same type of mice fed with same type of diet, determined by Student’s t test (P < .05; n = 4, biological replicates; 16 weeks on HFD). (B) Representative images (40×) of RFP-GFP-LC3 puncta in the livers of RFP-GFP-LC3 and RFP-GFP-LC3;iNOS KO mice fed an RD or HFD (16 weeks on HFD, fasted for 16 hours). Quantified numbers of the GFP-LC3 puncta/field are shown on the right of the panel. Data are shown as mean ± SEM. * indicates statistically significant difference relative to WT RD. determined by analysis of variance (ANOVA) followed by post hoc test (P < .05; 10 fields/group; n = 3, biological replicates). Scale bar: 10μm. (C) LC3 expression in livers from RFP-GFP-LC3 and RFP-GFP-LC3;iNOS-KO mice fed an RD or HFD (16 weeks on HFD, fasted for 16 hours). (D) Representative confocal images (63×) of primary hepatocytes isolated from WT or iNOS-KO mice (n = 3) transduced with Ad-mRFP-GFP-LC3 (MOI=2). Cells were treated with EBSS (4 hours). The number of the red LC3 puncta/field is noted at the top of each image. All data are presented as mean ± SEM. * indicates statistical significance compared with WT, # indicates statistical significance between HFD groups determined by ANOVA followed by post hoc test (P < .05; 10 fields/group; n = 3, biological replicates; 12 weeks on HFD). Scale bar: 10 μm. (E) Representative Western blots of LC3 conversion (arrow indicates LC3-II) and p62 expression in primary hepatocytes from livers of WT and iNOS-KO mice. EBSS (4 hours) was used to induce autophagy, and CQ (20 μM, 4 hours) was used to inhibit lysosomal degradation. Each lane contains a mixture of protein lysates from 3 mice. (F) Densitometry of Western blot analysis in E. * indicates statistical significance between EBSS and EBSS CQ groups in same type of mouse, determined by ANOVA followed by post hoc test (P < .05; n = 9, biological replicates; 12 weeks on HFD). (G) Representative transmission electron microscopy images (5,000×) of livers from fasting (16 hours) WT and iNOS-KO mice. Arrows: autophagic vesicles. Scale bar: 0.5 μm. Numbers at the top of each graph represent the average number of autophagic vesicles/7.5 μm2. All data are presented as mean ± SEM. * indicates statistical significance compared with WT RD; # indicates statistical significance between HFD group, determined by ANOVA followed by post hoc test (P < .05 n = 3, biological replicates; 12 images/mouse; 16 weeks on HFD). (H) Autophagic vacuoles in live primary hepatocytes from mice described in panel E, as detected by the Cyto-ID kit. Data are presented as mean ± SEM. * indicates statistical significance compared with WT RD in EBSS, # indicates statistical significance between HFD groups in the same treatment, and & indicates statistical significance compared with EBSS groups without CQ, determined by ANOVA followed by a post hoc test (P < .05; n = 3, biological replicates; 12 weeks on HFD).


