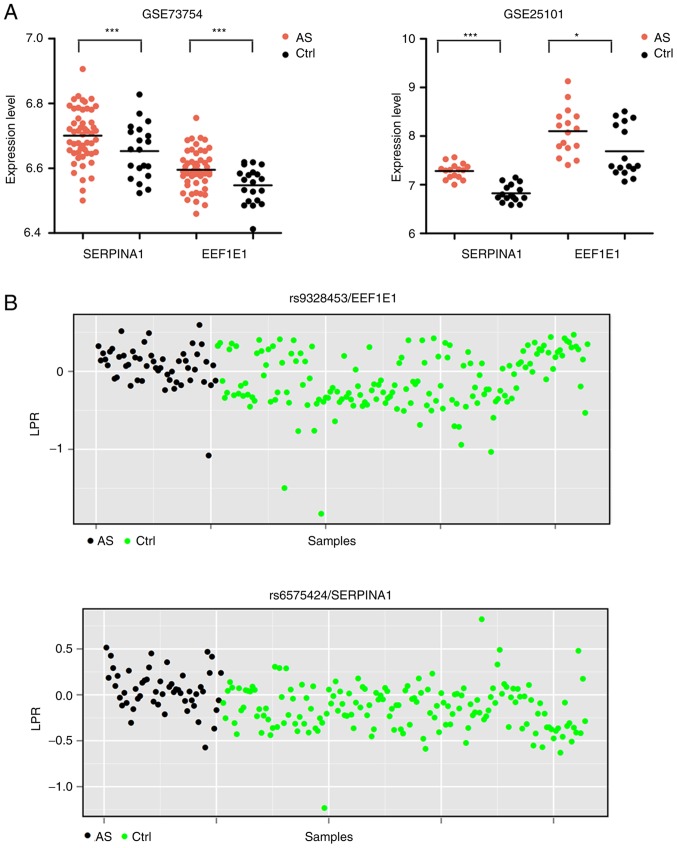
Figure 6.
The expression levels and LRR of SNP loci of EEF1E1 and SERPINA1. (A) The expression levels of EEF1E1 and SERPINA1 in blood samples of GSE73754 (AS: n=52; Ctrl: n=20) and GSE25101 (AS: n=16; Ctrl: n=20) datasets, respectively. *P<0.05; ***P<0.001. (B) LRR of SNPs in blood samples of GSE39428 (AS: n=51; Ctrl: n=163). Only the most significant SNPs were displayed. The t-test was used to determine the difference in expression and LRR between AS and Ctrl. AS, ankylosing spondylitis; Ctrl, control; LRR, Log R ratios; SNP, single nucleotide polymorphism.

