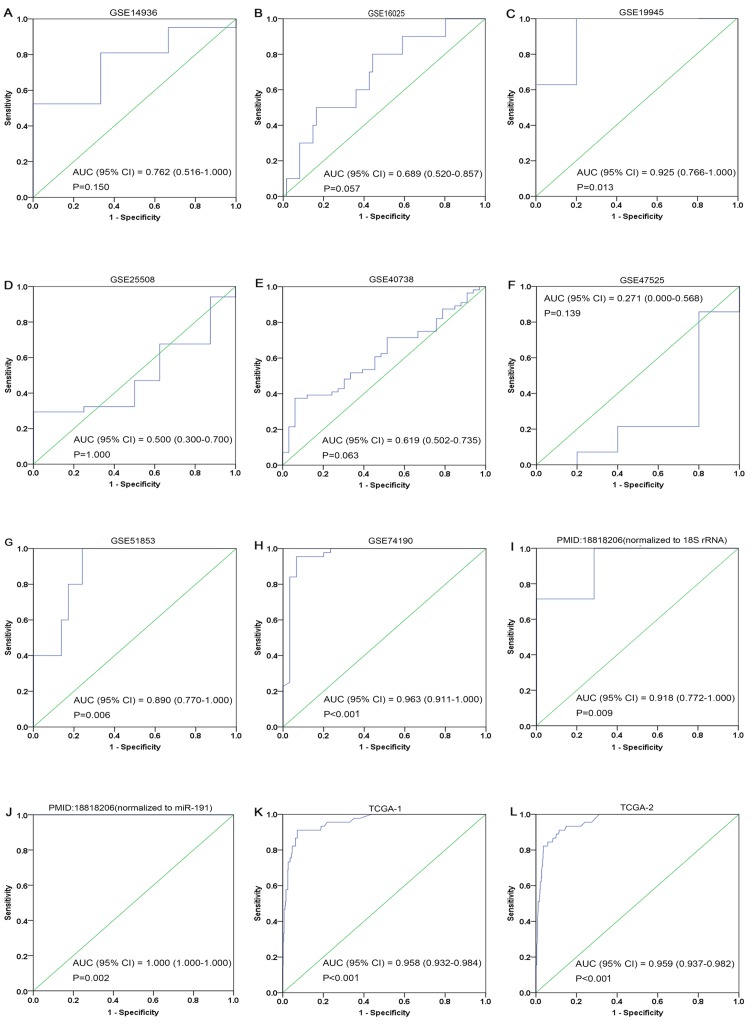
Figure 5.
ROC curves of microRNA-1 in lung squamous cell carcinoma. (A) GSE14936, (B) GSE16025, (C) GSE19945, (D) GSE25508, (E) GSE40738, (F) GSE47525, (G) GSE51853, (H) GSE74190, (I) 18818206-1, (J) 18818206-2, (K) TCGA-1 and (L) TCGA-2. Blue represents a sensitive curve and green indicates the identifying line. The X-axis, presented as ‘1-Specificity’, indicates the false positive rate. The Y-axis, presented as ‘Sensitivity’, indicates the true positive rate. ROC, receiver operating characteristic.

