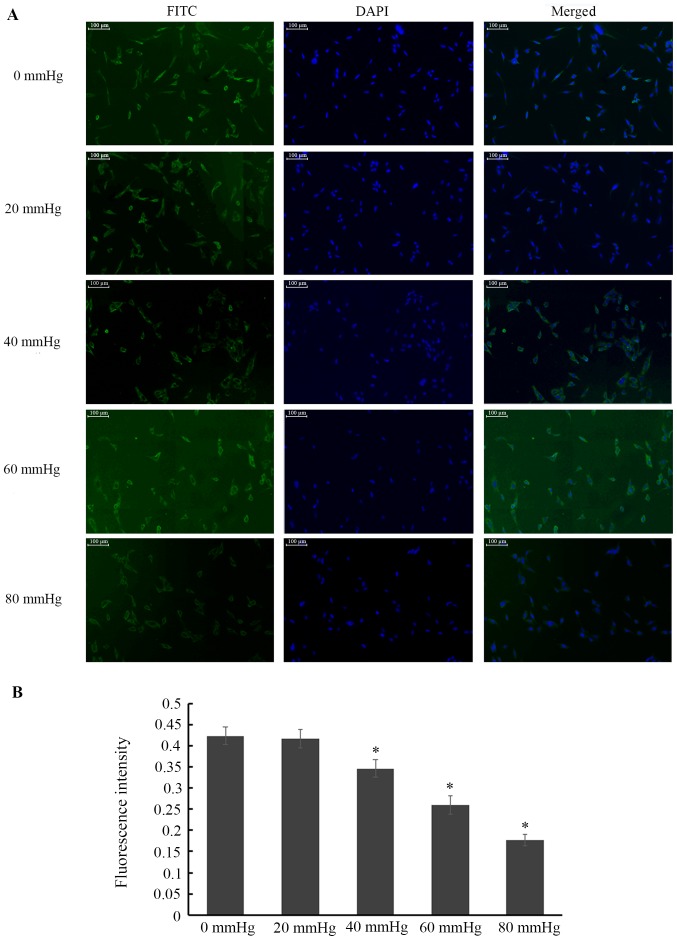
Figure 6.
Influence of elevated HP on AKT protein expression in each group of RGCs. (A) Micrographs of immunofluorescence exhibiting AKT expression in RGCs. Green is FITC immunofluorescence staining, and blue is DAPI staining (magnification, ×100). (B) Quantification and statistical analysis of fluorescence intensity. Data are presented as the mean ± standard deviation (n=3). *P<0.05 vs. the 0 mmHg group. HP, hydrostatic pressure; RGC, retinal ganglion cell; AKT, protein kinase B; FITC, fluorescein isothiocyanate.

