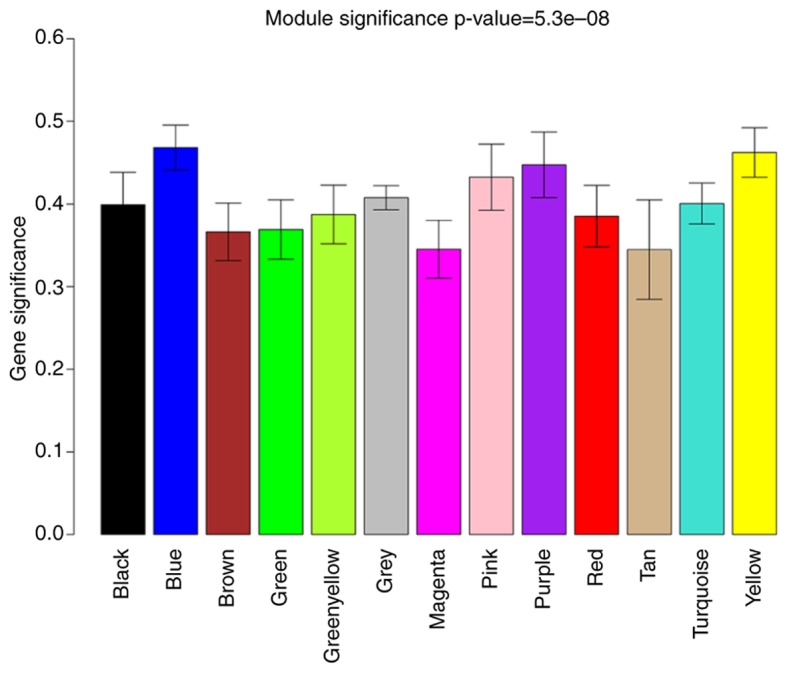
Figure 2.

The 13 sepsis-related co-expressed modules after weighted gene co-expression network analysis. The horizontal axis represents each different color module; the vertical axis represents the correlation coefficient between genes in each module and disease status.
