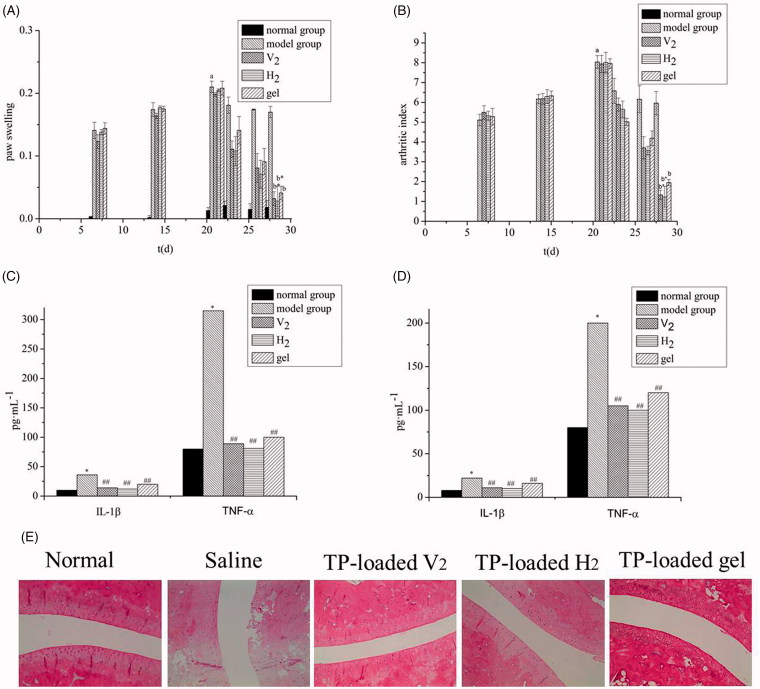
Figure 3.
Anti-rheumatoid arthritis effects: (A) Edema volume of rats with different treatments; (B) Arthritic index scores of rats with different treatments ( ± s, n = 8). a p<.01 vs. normal group, b p<.01 vs. model group, *p<.05 vs. gel group. The expression of inflammatory factors in blood (C) and synovial fluid (D). ( ± s, n = 8). *p<.01 vs. normal group, ## p<.01 vs. model group. (E) Photomicrographs of histopathological sections of ankle joints from rats after different treatments.

