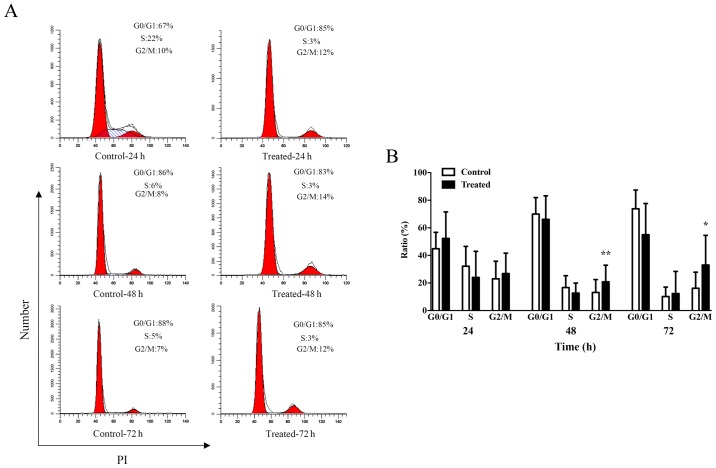
Figure 3.
TSA blocks the G2/M cell cycle phase of keloid fibroblasts. (A) PI staining was performed to analyze the cell cycle phase in response to 1,000 nM TSA treatment at 24, 48 or 72 h in culture. (B) Data are displayed as bar graphs. Results are presented as the mean ± standard deviation of three independent experiments (n=6). A two-tailed Student's t-test was used to compare the groups. *P<0.05 and **P<0.01 vs. respective control. TSA, trichostatin A; PI, propidium iodide.

