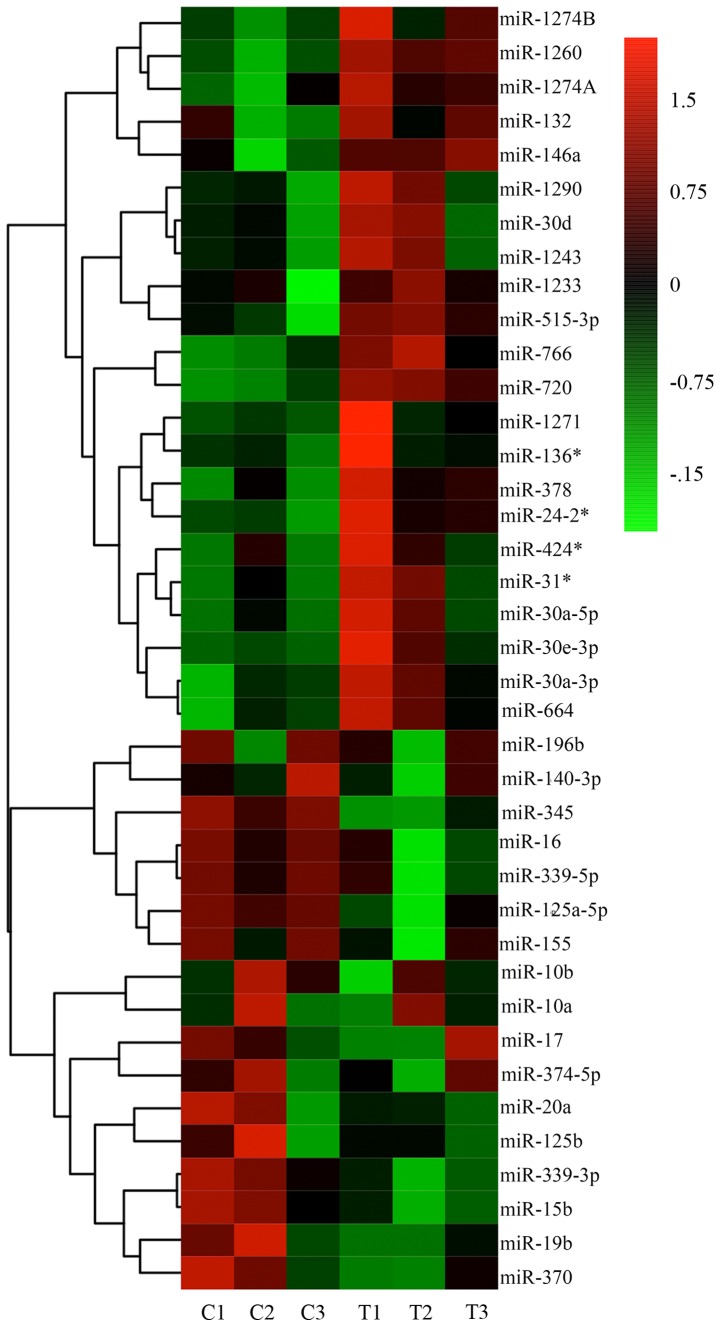
Figure 5.
Hierarchically clustered (average linkage) heatmap of TSA induction of modification in miRNA expression in keloid fibroblasts. A total of 10 miRNAs were downregulated and 22 miRNAs upregulated as demonstrated by the heatmap. Red, significantly increased expression; green, significantly decreased expression. U6 small nuclear RNA was selected as a control. n=3 for C and T groups. miRNA/miR, microRNA; TSA, trichostatin A; C, control; T, TSA-treated.

