Figure 3.

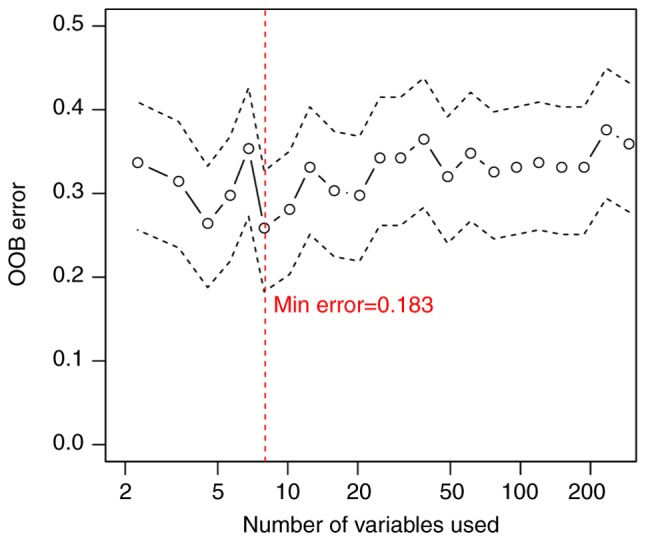
Random forest prediction model. The x-axis represents the number of long non-coding RNAs. The y-axis represents the OOB error rate. OOB, out-of-bag.

Random forest prediction model. The x-axis represents the number of long non-coding RNAs. The y-axis represents the OOB error rate. OOB, out-of-bag.