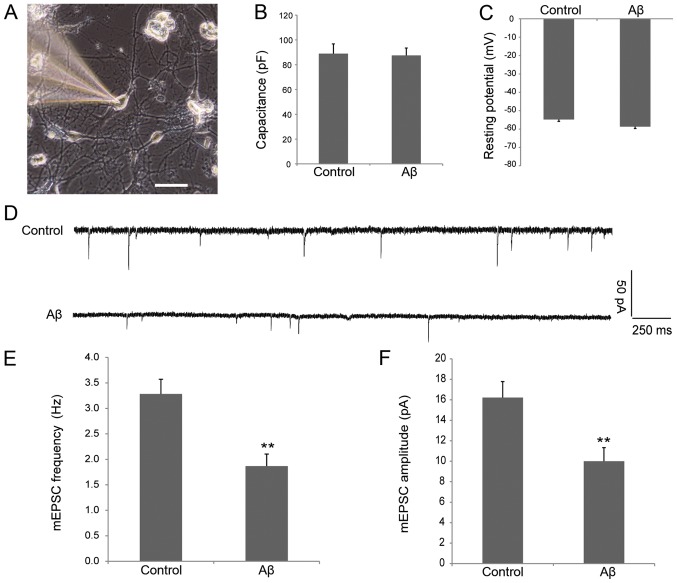
Figure 1.
Electrophysiology of cultured hippocampal neurons treated with oligomeric 1 µM Aβ. (A) Image of a neuron obtained from patch recording captured using an inverted fluorescence microscope. Scale bar, 50 µm. Bar plots represent the mean values of resting (B) capacitance and (C) membrane potentials of patched neurons in the control and oligomeric Aβ-processed groups. n=10 cells per group. (D) mEPSC tracings are shown for control and oligomeric Aβ-treated neurons. (E) mEPSC frequency in control and oligomeric Aβ-treated neurons. (F) mEPSC amplitude in control and oligomeric Aβ-treated neurons. n=16 cells per group, **P<0.01 vs. control. Aβ, amyloid β; mEPSC, miniature excitatory postsynaptic current.

