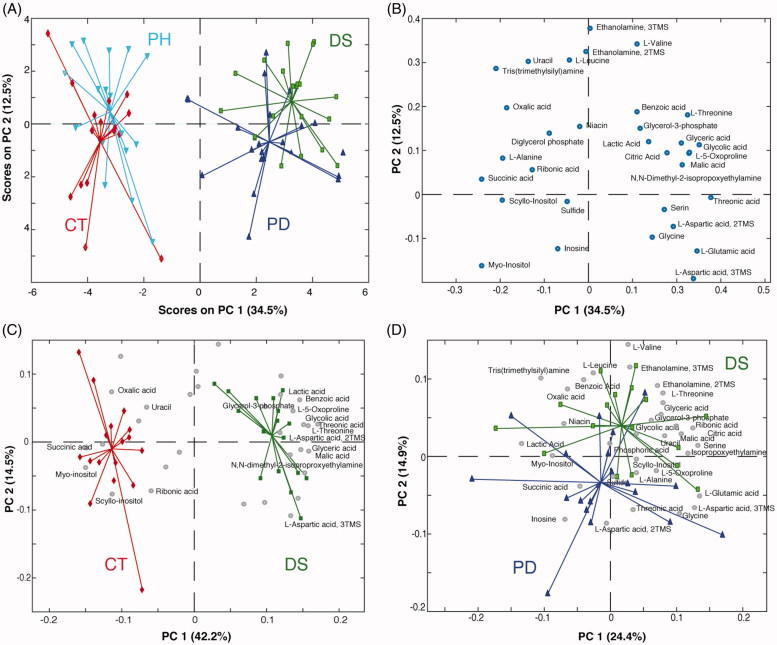
Figure 2.
(A) PCA scores plot and (B) loading plot of the GC-MS data (distal colon). Bi-plot showing PC1 vs. PC2 scores of the PCA model calculated on (C) CT and DS groups and (D) DS and PD groups (distal colon). Keys: Controls (CT, red), DSS-induced colitis (DS, green), Phytosterols-fed colitis mice (PD, blue), and Phytosterols-fed control group (PH, light blue).

