Figure 1.

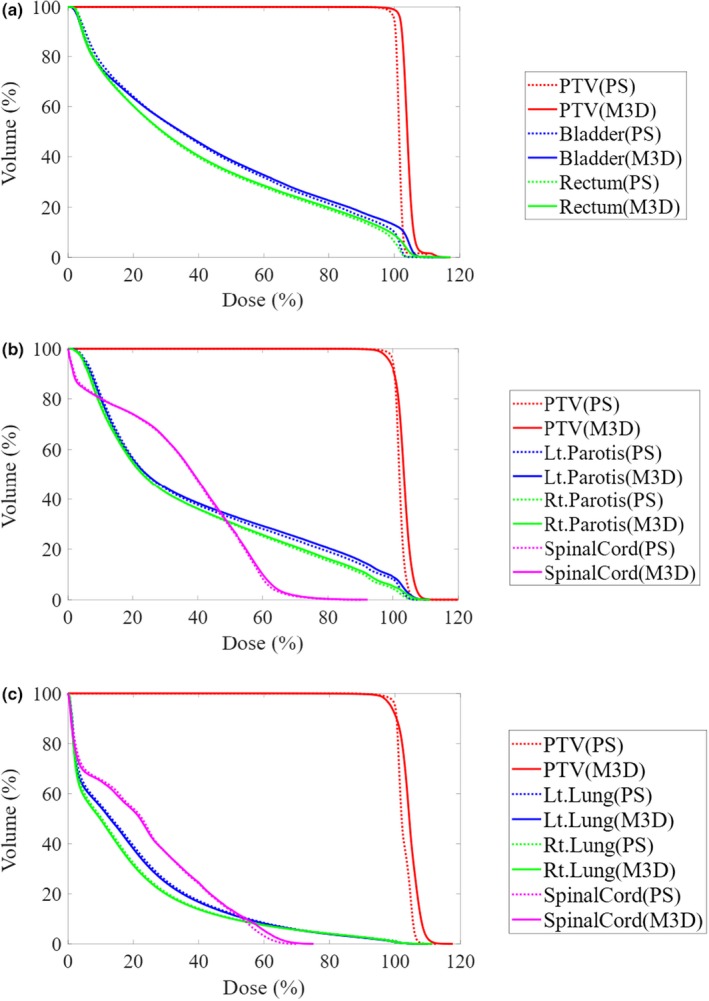
The mean dose‐volume histogram calculated by Mobius3D (M3D) and Planning Station (PS) at (a) the prostate, (b) the head‐and‐neck, and (c) the esophagus.

The mean dose‐volume histogram calculated by Mobius3D (M3D) and Planning Station (PS) at (a) the prostate, (b) the head‐and‐neck, and (c) the esophagus.