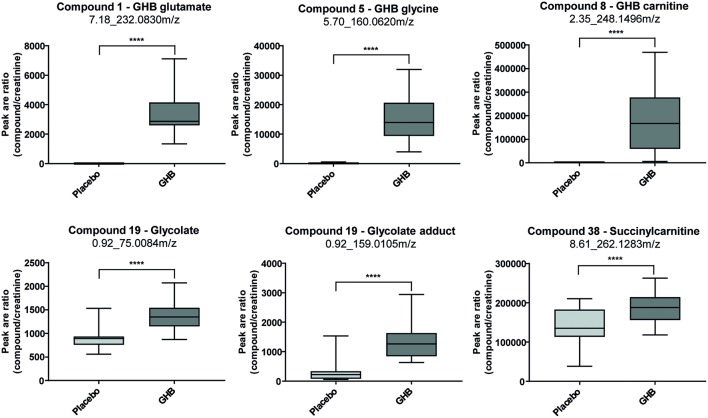
Figure 3.
Box plots for promising analytical targets of GHB consumption representing observed changes between placebo and GHB intake [shown as analyte peak area to creatinine peak area ratios (n = 19 each)]. Statistical evaluation was carried out using a paired t-test (p < 0.05; ****p < 0.0001). Reprinted (adapted) with permission from Steuer et al. (2018c). Copyright 2018, Wiley.

