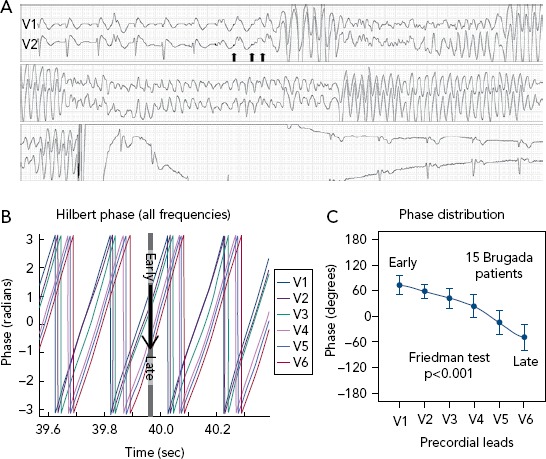
Figure 2: Example of VF Induction.

A: Example of VF induction during a programmed ventricular stimulation with three coupled extra-stimuli (arrows). It lasts 17 seconds and needs an external cardiac defibrillator shock to finish. B: Example of Hilbert transform of VF signal in a patient with Brugada syndrome. It provides the time course of the phases along the precordial locations. C: Cumulative data of phases in a subset of patients with Brugada syndrome. B and C show that the phase distribution of the signals denotes a sequence from early in V1 to late in V6 (black arrow, 95% CI). Overall, organisation of the phase-frequency content during VF points to the outflow tracts as the source of high-frequency inputs maintaining VF. Source: Calvo et al. 2015.43 Adapted with permission from Wolters Kluwer Health.
