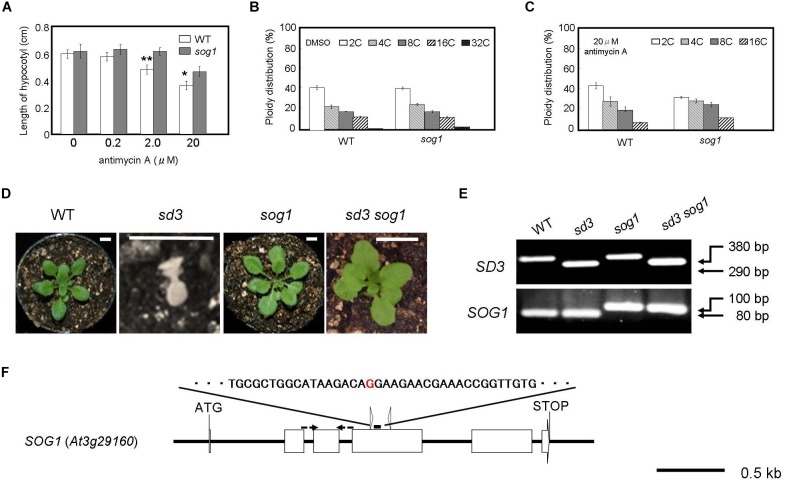
FIGURE 3.
Severe dwarf morphology of sd3 in light was partially rescued by introduction of sog1. (A) Schematic illustration of the SOG1 gene and point mutation site. The red character indicates the point mutation (G to A). The point mutation mutant produces a 100 bp PCR fragment and WT an 80 bp fragment after digestion with ScrFI (New England BioLabs). (B) Phenotype of 3-day-old seedlings of WT (Col-0) and sog1 grown on medium containing 0 (DMSO), 0.2, 2.0, and 20 μg/ml antimycin A in the dark. Approximately 80 seedlings were measured. Error bars indicate standard deviation. (C,D) Relative ratio of each ploidy of cells of 3-day-old seedlings of WT (Col-0) and sog1 grown on medium containing 0 (DMSO) (C) and 20 μg/ml antimycin A (D) in the dark. Approximately 20 seedlings were used for ploidy analysis. Error bars indicate standard deviation of five biological replicates. Asterisks indicate significance at P < 0.05 by t-test when compared to sog1. (E) Photographs show phenotypes of 35-day-old light-grown seedlings. From left, WT, sd3, sog1, and sd3sog1 are shown. Scale bar: 0.5 cm. (F) Upper and bottom panels show PCR bands for genotyping SD3 and sog1, respectively. The genotyping primers are specified in Supplementary Table S1. The PCR products of SD3 and SOG1 were separated on 1.2% and 3% agarose gels, respectively.

