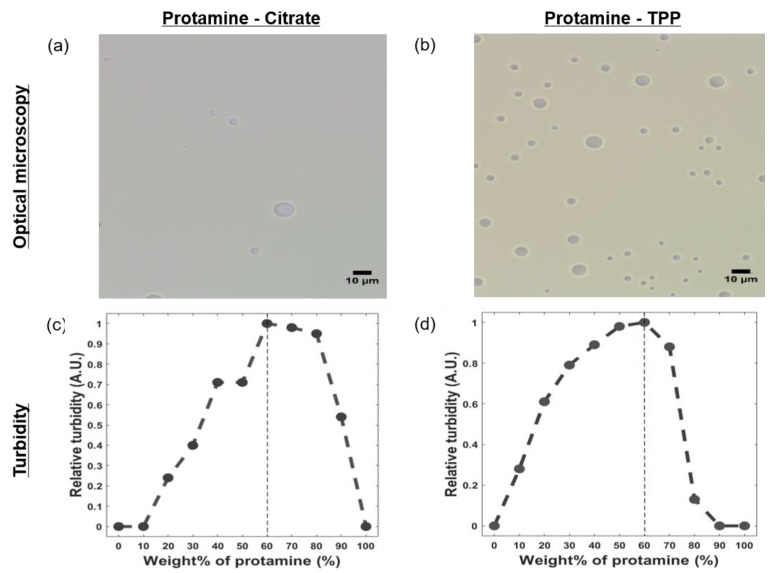
Figure 2.
Optical microscopy image of (a) protamine/citrate coacervate obtained at pH 8.0 and (b) protamine/ tripolyphosphate (TPP) coacervate at pH 4.5. The total polyelectrolyte concentration (Cp) was 1% (w/v), and the scale bar is 10 μm. The optical turbidity of (c) protamine/citrate coacervates and (d) protamine/TPP coacervates with different weight ratios. Cp was 0.1% (w/v).

