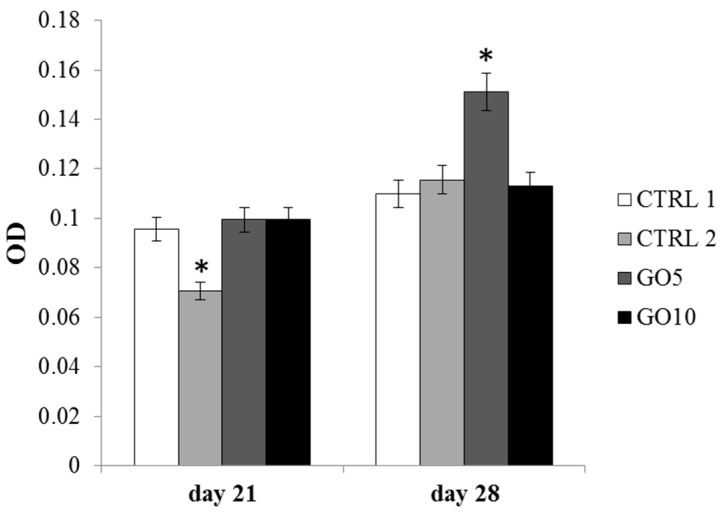
Figure 8.
The histogram represents optical density (OD) values of solubilized calcium deposits (orange-red stained) obtained after Alizarin Red staining on bare Laminas (CTRL1), APTES-treated (CTRL2), 5 µg/mL GO-coated (GO5) and 10 µg/mL GO-coated (GO10) Laminas. Twenty Laminas were used for each experimental point, ten Laminas per experimental time. Data shown are the mean (±SD) of three separate experiments. * Day 21: APTES-treated Laminas vs. control (CTRL1) Laminas p < 0.005; * Day 28: control Laminas, APTES-treated, 10 µg/mL GO-coated Laminas (GO10) vs. 5 µg/mL GO Laminas (GO5) p < 0.005.

