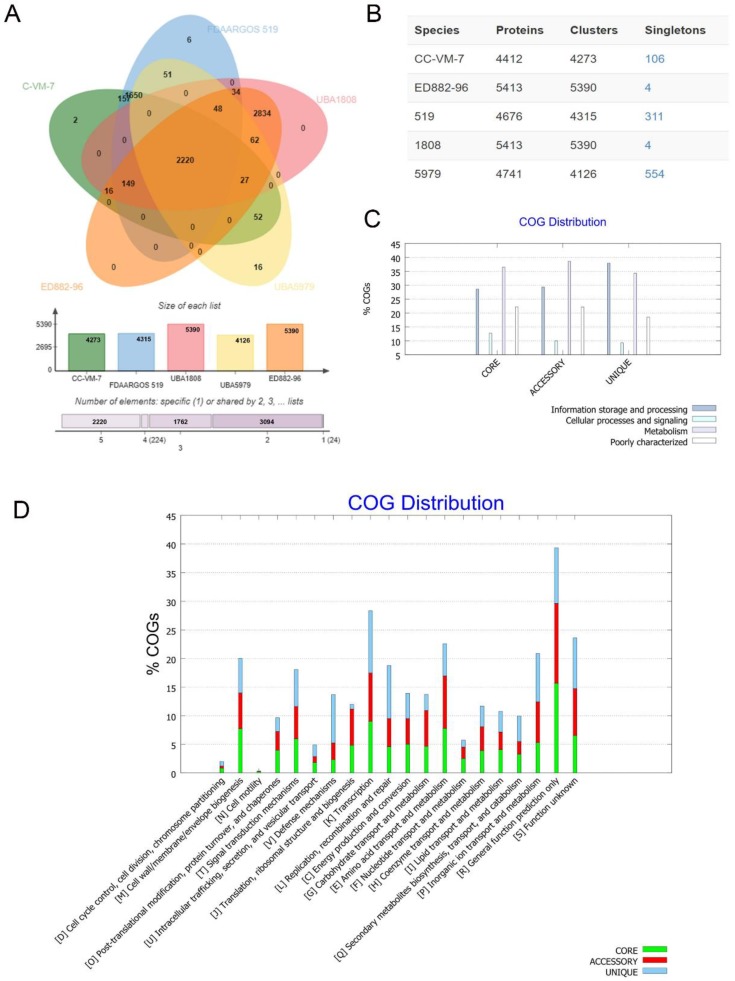
Figure 5.
Proteome comparison among C. arthrosphaerae strains ED882-96, CC-VM-7T, FDAARGOS_519, UBA1808, and UBA5979. (A) The Venn diagram and bar chart represent the numbers of unique and shared orthologous genes of each strain. (B) The number of proteins, clusters, and singletons in each strain of C. arthrosphaerae. (C) Clusters of orthologous groups (COGs) in core, accessory, and unique genomes and their associated functions. (D) Detailed distribution of COGs with their functions.

