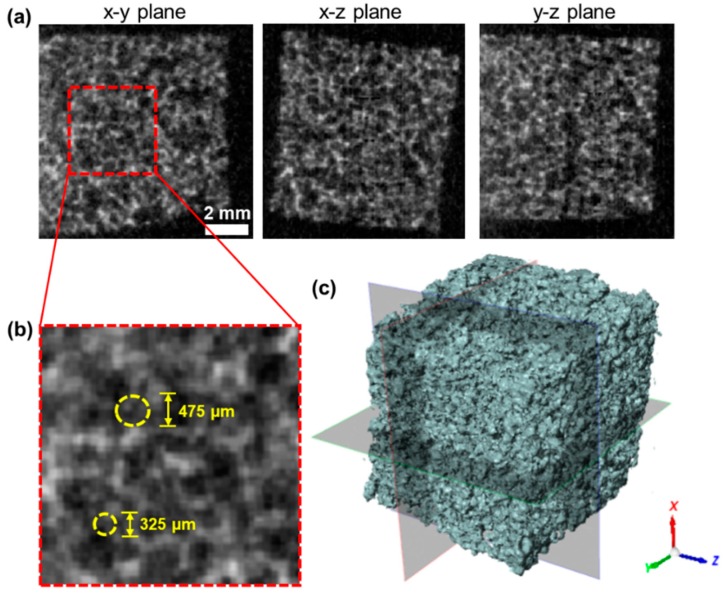
Figure A1.
Micro-CT images showing the microstructure of SMP foam: (a) 2D image slices on orthogonal planes, (b) zoom-in area of the 2D image slice on the x-y plane, demonstrating the typical pore sizes of the SMP foam, and (c) the visualization of the reconstructed 3D geometry of the cubic SMP foam (10 mm by 10 mm by 10 mm).

