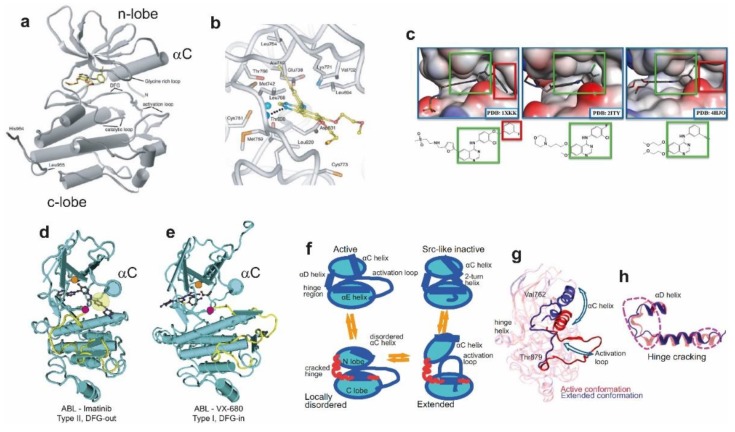
Figure 2.
Structure and dynamics of the kinase domain. (a) Structure of the EGFR kinase domain with the inhibitor erlotinib bound in the cleft between the amino-terminal and carboxy-terminal lobes (PDB: 1M14). Taken, with permission, from Stamos et al. [120]. (b) The inhibitor binding site and nearby residues from the EGFR kinase domain complexed with erlotinib. The dashed line indicates an H-bond from the receptor to the drug, and a water molecule is shown as a pale blue sphere. Taken, with permission, from Stamos et al. [120]. (c) Structures of the EGFR binding site with three different inhibitors bound; 1XKK (Lapatinib) [125], 2ITY (gefitinib) [126], 4HJO (erlotinib) [127]. (d) Structure of Abelson murine leukemia viral oncogene homolog 1 (ABL) kinase domain complexed with the type II inhibitor imatinib, showing the DFG-out conformation [128]. Both panels were taken, with permission, from Treiber and Shah [129]. (e) Structure of ABL kinase domain complexed with the type I inhibitor VX-680, showing the DFG-in conformation [130]. (f) MD simulations of the EGFR kinase monomer in the time scale of 25 µs showing transitions between the active state and both the Src-like inactive and the DFG-out inactive states of EGFR kinase. (g) Comparison of the extended conformation (blue) with the initial active conformation (red). (h) Close-up of the hinge region, with and without hinge cracking (blue and red, respectively). (f–h) taken, with permission, from Shan et al. [131].

