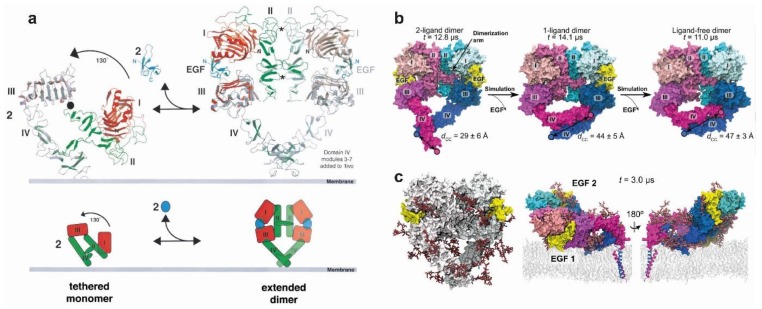
Figure 3.
The ligand-bound extracellular back-to-back dimer. (a) A model of ligand-induced EGFR dimerization. The transition is shown between the monomer tethered structure on the left (model derived from [85]) and the active dimer on the right (model derived from [31]). The “back-to-back” dimer includes the DIV modules missing from earlier structures. Taken, with permission, from Burgess et al. [170]. (b) Simulation of the effects of removal of the ligand, showing a significant rearrangement by which the gap between DI and DIII left by the detached ligand is filled, and a bending motion of DIV around the hinge region with DIII leads to a separation between the C-terminal portions of DIV. Taken, with permission, from Arkhipov et al. [67]. (c) A simulation showing the fully glycosylated ectodomain dimer. The glycans are coloured by atom type (carbon in grey, oxygen in red and nitrogen in blue). The conformation after 3 µs of simulation is shown on the right, from two opposing viewpoints. Taken, with permission, from Arkhipov et al. [45].

