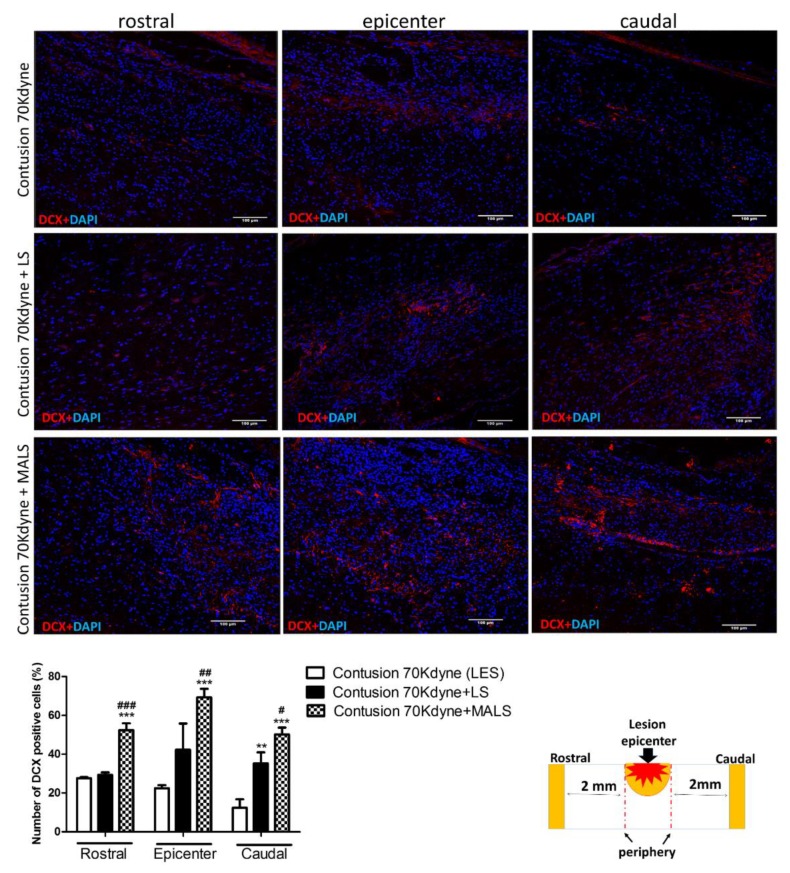
Figure 6.
MALS tissue promotes re-growth of neurons. Spinal cord longitudinal sections were examined for DCX (red) expression 35 days after MALS transplant. Scale bar: 100 µm. The graph shows the quantification of positive cells (percentage) in sections taken at the lesion epicenter, 2 mm rostral or caudal to the lesion epicenter (please see schematic representation). Values represent mean ± SD. We determined the statistical differences by means of one-way ANOVA test followed by Bonferroni’s post-test. ** p < 0.01, *** p < 0.001 vs. LES, # p < 0.05, ## p < 0.01, ### p < 0.001 vs. LS. (n = 4 mice; 2 sections/mouse; 3 fields/section area).

