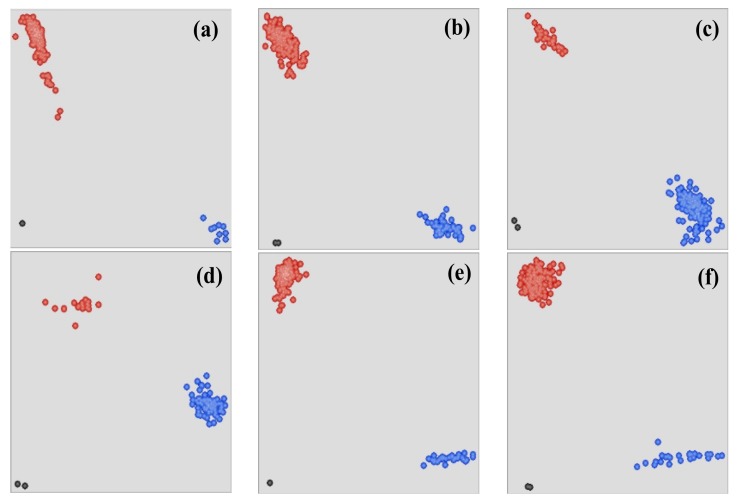
Figure 2.
Scatter plot for KASP assays; showing clustering of accessions on the X-(FAM) and Y-(HEX) axes. Accessions colored blue have the FAM- type allele; accessions colored red have the HEX-type allele; black dots represent the NTC (non-template control). (a–d): TaSSIV-A. (a) KASP-A1673T, (b) KASP-A2403C, (c) KASP-C2436T, (d) KASP-C5952T, (e,f) TaSSIV-B. (e) KASP-C1560T, (f) KASP-C6107T.

