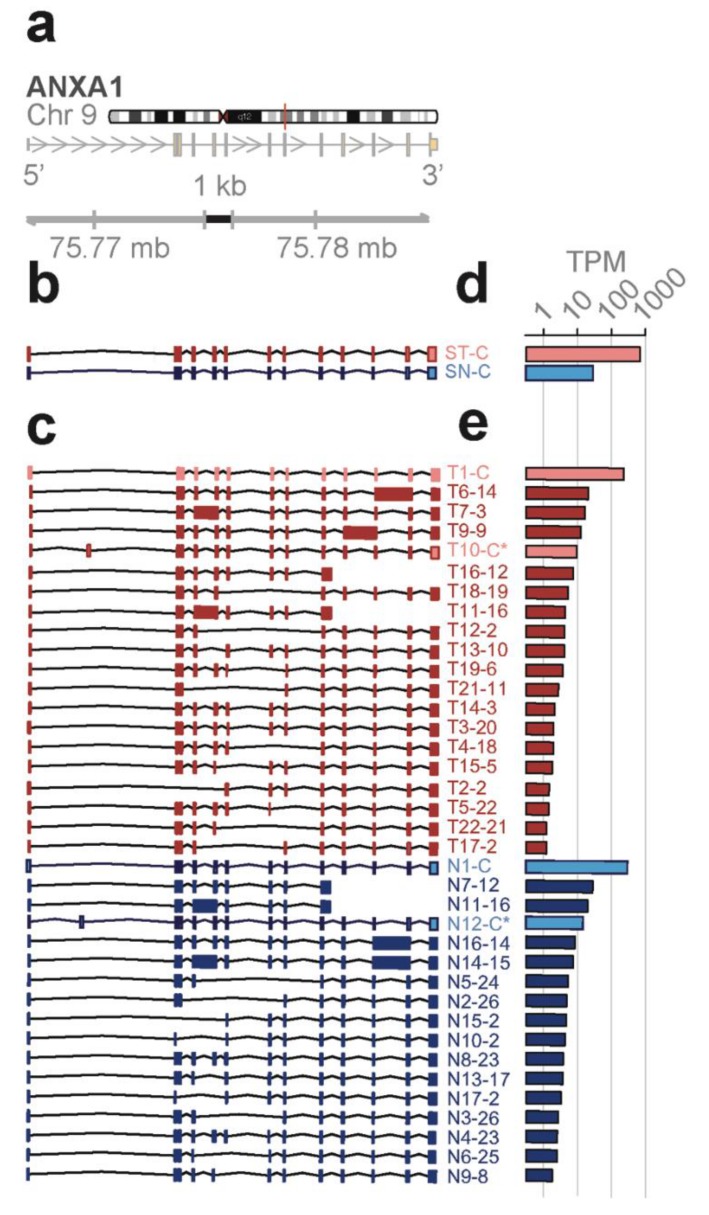
Figure 4.
mRNA isoforms of the ANXA1 gene. (a) Reference gene model from hg19. Arrows indicate direction of transcription. (b–e) Results for lineage-neg (blue) and total BM (red) from short-read RNA-seq (b,d) or full-length RNA-seq (c,e). Isoforms and abundances (TPM, transcripts per million reads) discovered in lineage-neg (blue) and total BM (red) population by short-read (b,d) or full-length RNA-seq (c,e). S, short-read RNA-seq; C, canonical transcript and open reading frame (ORF); C*, non-canonical transcript isoform with canonical ORF; ORFs are shown in Figure S1. ID#s of the isoforms are from the identifiers generated by the sequencing methods. Ensembl IDs are included in Table S9, NCBI Accession numbers in Table S12.

