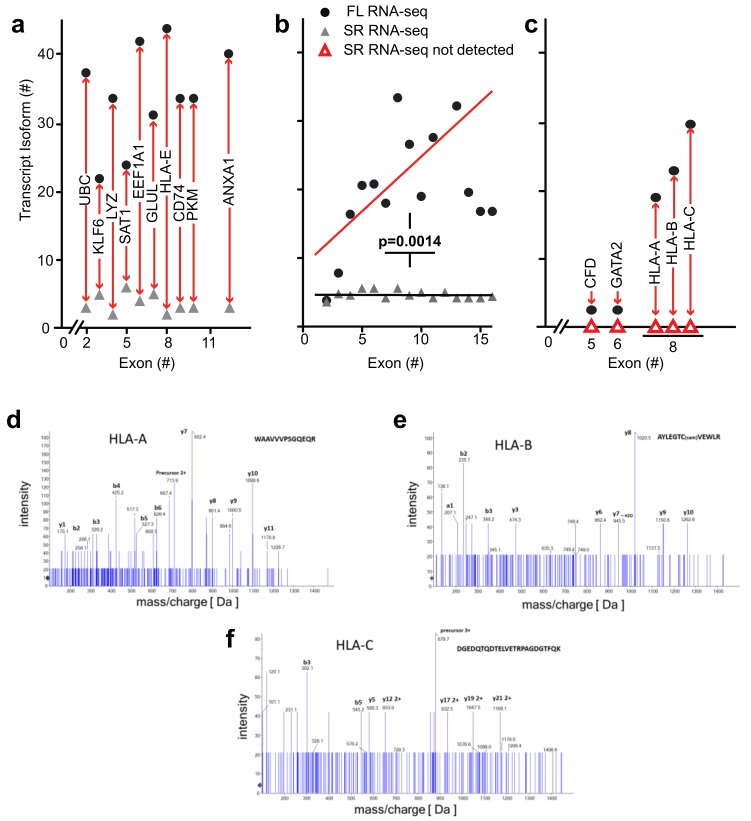
Figure 5.
Transcript isoform detection for genomic loci of different complexity and redundancy. (a–c) The number of transcript isoforms detected (y-axes) by full-length (FL; filled circles) and short-read (SR; triangles) RNA-seq is shown relative to the number of canonical exons (x-axes; hg19 gene annotation). (a) Representative genes with 3 to 13 canonical exons. Full gene names and isoform numbers are provided in Table S3. (b) Comparison of the mean of the transcript isoforms for the five most abundant genes with 2 to 16 exons from the analysis of all bone marrow cell populations (p = 0.0014; Chi-sq. for trend short-read (SR) RNA-seq versus full-length (FL) RNA-seq). The numbers of transcript isoforms for each of the subgroups are in Table S5a. (c) Transcripts and isoforms identified only by full-length RNA-seq. Gene names and numerical values are in Table S4. (d–f) Manually assigned fragmentation spectra for peptides matching with HLA-A, -B, and -C transcripts. Peptides were detected using non-targeted shotgun proteomics analysis of proteins extracted from lineage-negative bone marrow cells. Detection of the peptides confirms expression of HLA-A, -B, and -C.

