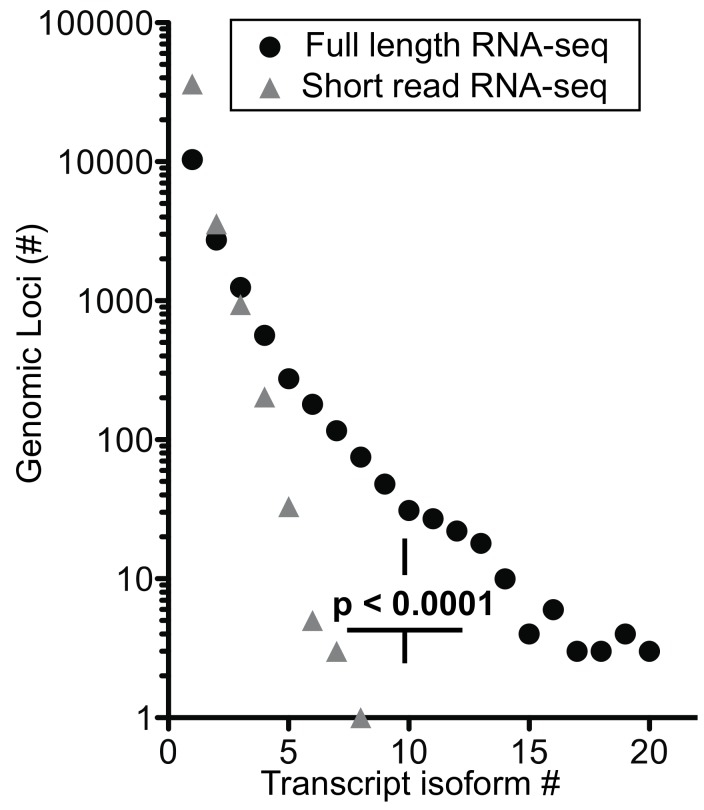
Figure 6.
Number of transcript isoforms mapped to distinct genomic loci. Comparison of short-read (SR) versus full-length (FL) RNA-seq, p < 0.0001; Chi-square for trend. The distribution of exon counts per transcript isoform and transcript isoform counts per genomic locus are provided in Table S5c,d.

