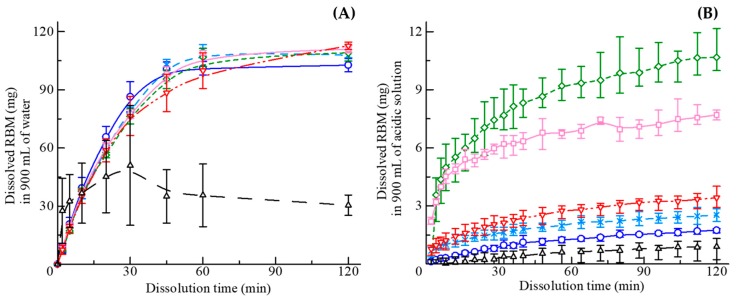
Figure 8.
Integrated dissolution profiles in 900 mL of (A) tablets in water and (B) granules in an acidic solution of RBM crystal (dark triangles), PVP-VA 0% (blue circles), PVP-VA 5% (light blue crosses), PVP-VA 10% (green diamonds), PVP-VA 20% (light red rectangles), and PVP-VA 30% (red inversed triangles). Percentages denote the concentration of PVP-VA in the SGR granules.

