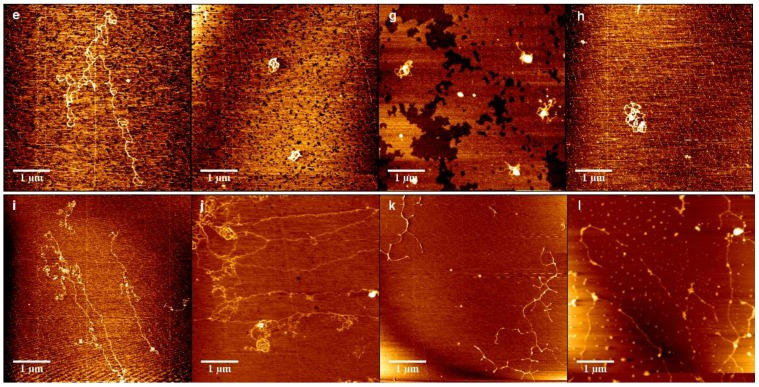
Figure 8.
Atomic force images of DNA-chitosan complexes at different chitosan concentrations and pHs. The concentration of Figure (a–d) chitosan is 0.1 µM, 0.15 µM, 0.35 µM, 0.45 µM, () respectively, pH = 4.6. Similarly, in (e–h), the concentration of chitosan is 0.15 µM, 0.2 µM, 0.25 µM, 0.3 µM, (), respectively, pH = 7. In (i–l), the concentration of chitosan is 0.2 µM, 0.26 µM, 0.28 µM, 0.36 µM, (), respectively, pH = 8.


