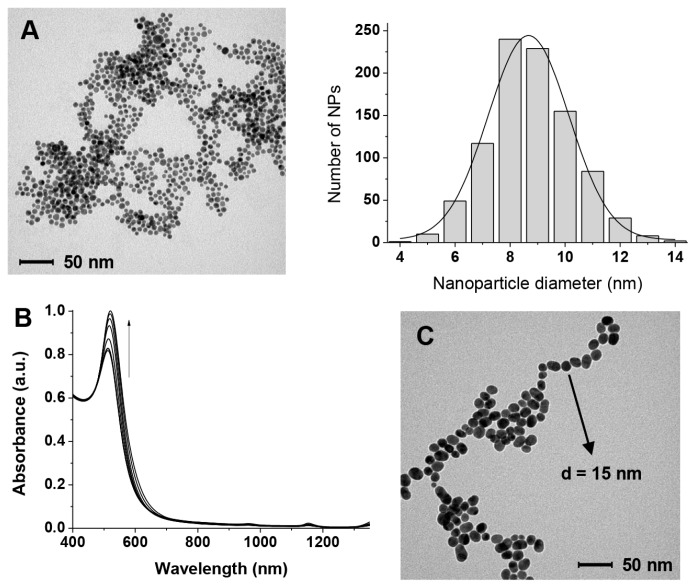
Figure 2.
(A) TEM image and size distribution of the gold nanoparticles (AuNPs) used in this work passivated with citrate; (B) Evolution with time of the Vis spectrum in the plasmon resonance region of the AuNPs after citrate depletion (over 7 days, curves were recorded at 1-day intervals); (C) TEM image of the citrate-depleted AuNPs after 7 days (notice the same scale bar as in (A)).

