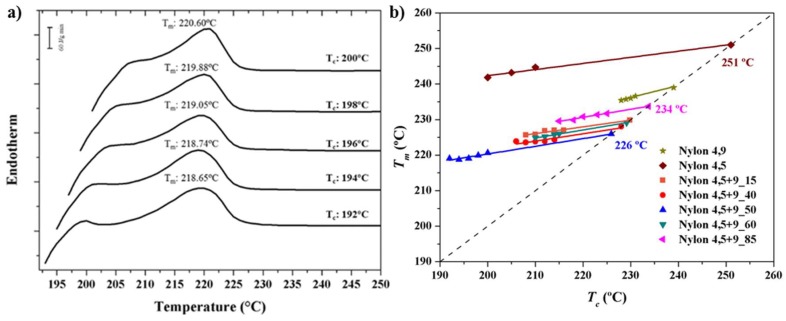
Figure 4.
DSC heating scans (20 °C/min) of nylon 4,5+9_50 (a) samples isothermally crystallized at the indicated temperatures. (b) Hoffman–Weeks plot of temperatures corresponding to the predominant melting peak versus crystallization temperature for nylons 4,5+9_X samples. Equilibrium melting temperatures are explicitly indicated at the intersection point with the Tm = Tc line.

