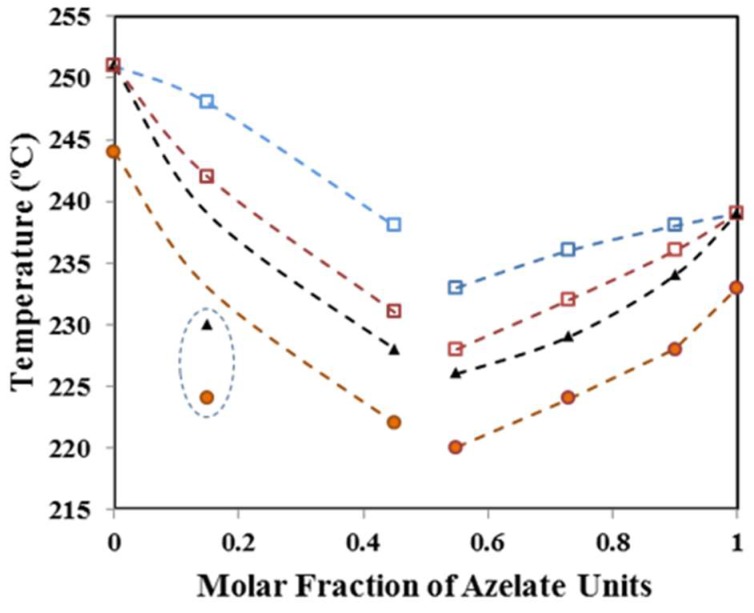
Figure 5.
Composition dependence of the experimental (▲) and theoretical equilibrium melting temperature according to Flory (□) and Bauer (□) models. For the sake of completeness, the main melting peak temperatures observed in the second heating run (●) are also plotted. Dashed circle points out experimental values that strongly deviate from theoretical values.

