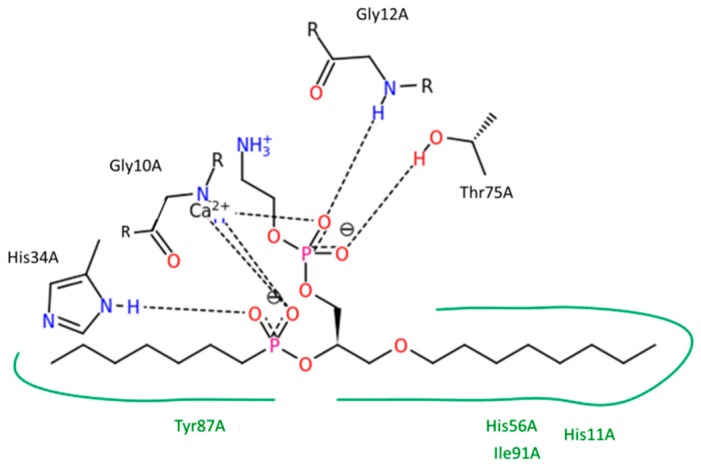
Figure 9.
Binding pocket of bee venom PLA2 with a transition state analog, phospholipid [45]. PoseView diagram: Black dashed lines indicate hydrogen bonds, salt bridges, and metal interactions. Green solid lines show hydrophobic interactions and green dashed lines show π–π and π-cation interactions. Interactions are determined by geometric criteria, as previously described [47].

