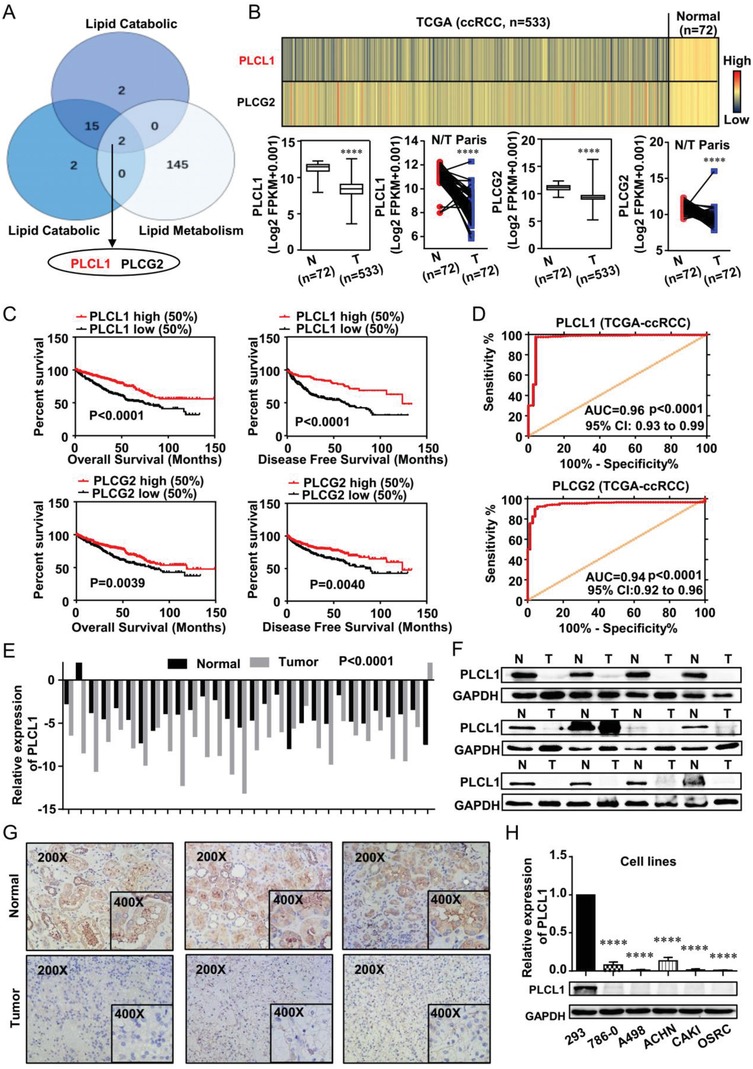
Figure 1.

PLCL1 was downregulated and predicted poor prognosis in ccRCC. A) A Venn diagram of three independent lipid‐related gene sets from the Oncomine database (https://www.oncomine.org) and the European Bioinformatics Institute (EMBL‐EBI) (https://www.ebi.ac.uk). (All gene sets are subgene sets of differentially expressed genes in ccRCC.) B) The mRNA levels of PLCL1 and PLCG2 in 533 ccRCC tissues and 72 paired tissues in ccRCC based on data from the TCGA database. (In the color scheme of the heatmap, the colder color represents the lower gene expression level, and the warmer color represents the higher gene expression level.) t‐test, p < 0.0001. C) The Kaplan–Meier curves of PLCL1 and PLCG2 in ccRCC for both overall survival (OS) and disease‐free survival (DFS). D) The ROC (receiver operating characteristic) curves of PLCL1 (AUC = 0.9642 95% CI: 0.9343 to 0.9941; p < 0.0001) and PLCG2 (AUC = 0.9466 95% CI: 0.9253 to 0.9678; p < 0.0001) in ccRCC. E) The mRNA levels of PLCL1 in 30 ccRCC tissues and adjacent nonmalignant tissues. t‐test, p < 0.0001. F) The protein levels of PLCL1 in ccRCC tissues and adjacent nonmalignant tissues (Abbreviation: N, Normal tissue; T, Tumor tissue). G) The immunohistochemistry (IHC) staining for PLCL1 in ccRCC tissues and adjacent nonmalignant tissues (Magnification: 200× & 400×). H) The mRNA and protein levels in five ccRCC cell lines (786‐0, A498, ACHN, CAKI, and OSRC) and normal cell line (293). t‐test, ****p < 0.0001.
