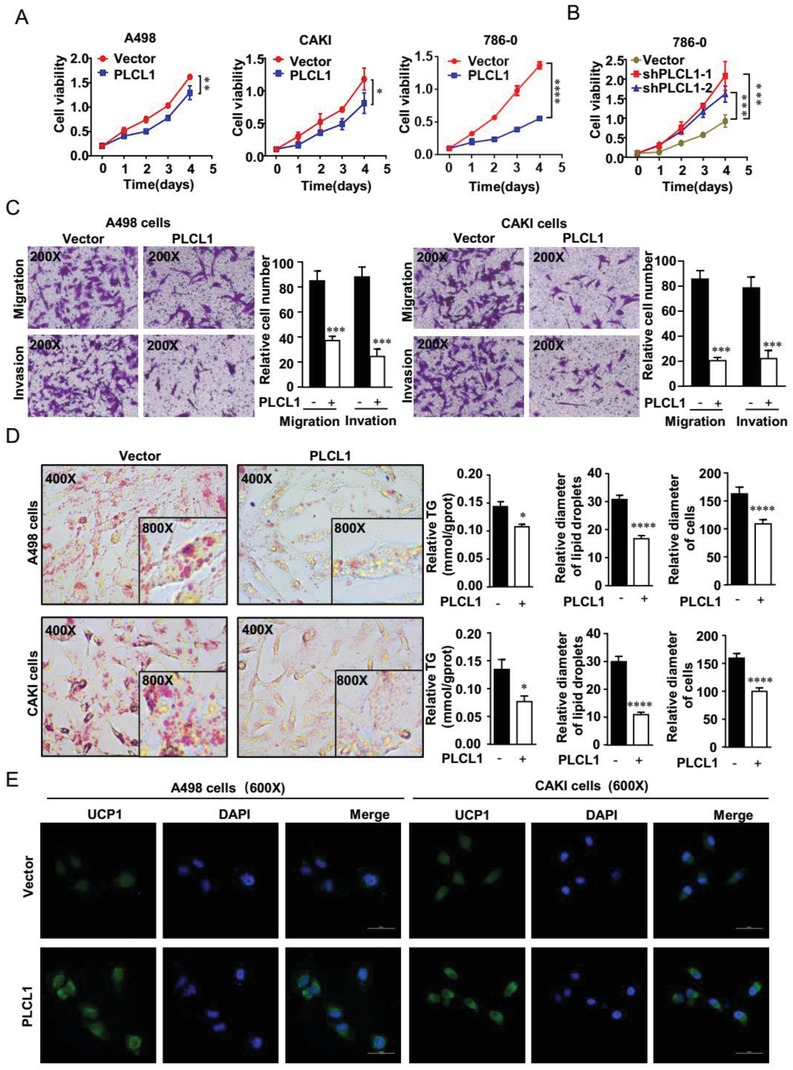
Figure 2.

PLCL1 repressed ccRCC progression and promoted tumor cell “slimming” in ccRCC. PLCL1‐overexpressing or PLCL1‐knockdown ccRCC cell lines were constructed by transfecting overexpressing lentivirus and shRNA. The results were plotted as the mean ± SEM of three independent experiments with at least three replicates in each independent experiment. ****, p < 0.0001, ***, p < 0.001, **, p < 0.01, *, p < 0.05. A,B) Cell growth curves of CCK8 assays for indicated cells. C) Migration and invasion assay for indicated ccRCC cells (Magnification: 200×). D) Photomicrographs of Oil Red O staining of PLCL1‐overexpressing cell lines and the negative control (Magnification: 400× & 800×). Relative TG (mmol/gprot) tested by a triglyceride assay kit, relative diameters of lipid droplets, and relative diameters of cells for ccRCC cells described above. t‐test, ****, p < 0.0001, ***, p < 0.001, *, p < 0.05. E) Representative photographs of immunofluorescence of UCP1 for cells overexpressing PLCL1 (Magnification: 600×).
