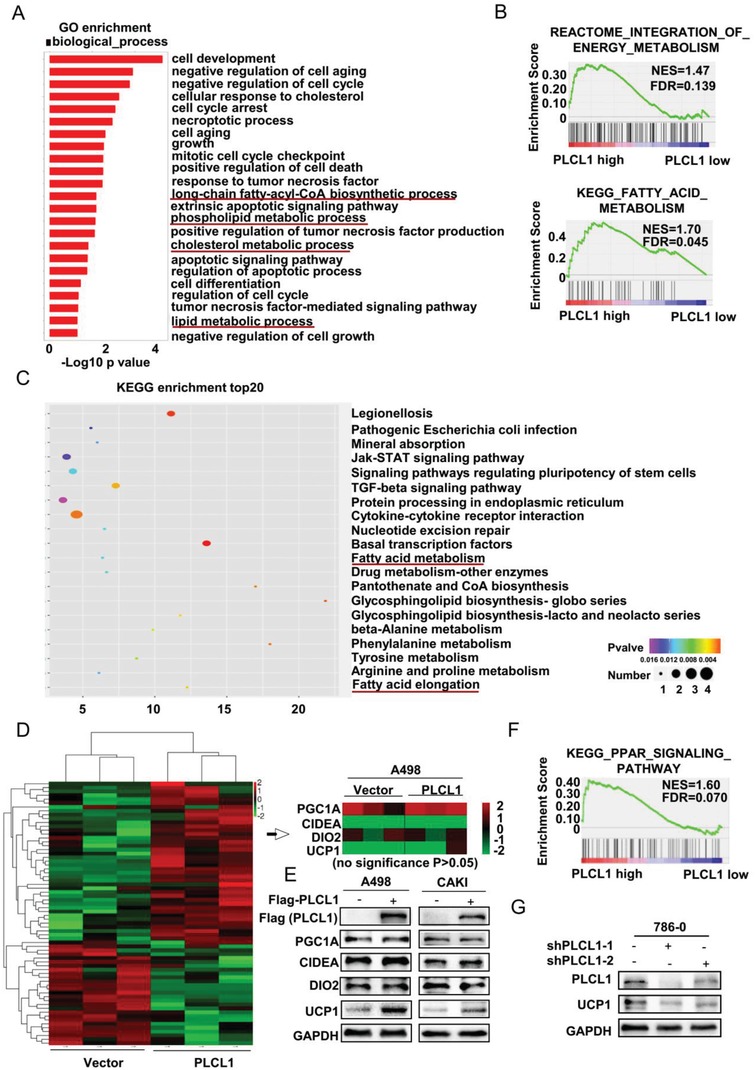
Figure 3.

PLCL1 upregulated the expression of the lipid browning related gene UCP1 in ccRCC cells. Transcriptome sequencing was performed for A498 cells overexpressing PLCL1. A) GO enrichment for the indicated cells based on the results from sequencing. B) GSEA assays for the correlation of energy metabolism, fatty acid metabolism, and mRNA levels of PLCL1 according to the TCGA database. FDR < 25%, p < 0.05 was considered statistically significant. C) KEGG (Kyoto Encyclopedia of Genes and Genomes) enrichment top 20 for indicated cells based on the results from sequencing. D) The heatmap of cluster analysis based on sequencing results. E) Lipid browning‐related proteins were determined by western blot analysis. GAPDH was used as a loading control. F) GSEA assays for the correlation of PPAR signaling and mRNA level of PLCL1 according to TCGA database. FDR < 25%, p < 0.05 was considered as statistically significant. G) Western blot assay for the protein levels of PLCL1 and UCP1 in the PLCL1‐knockdown cells.
