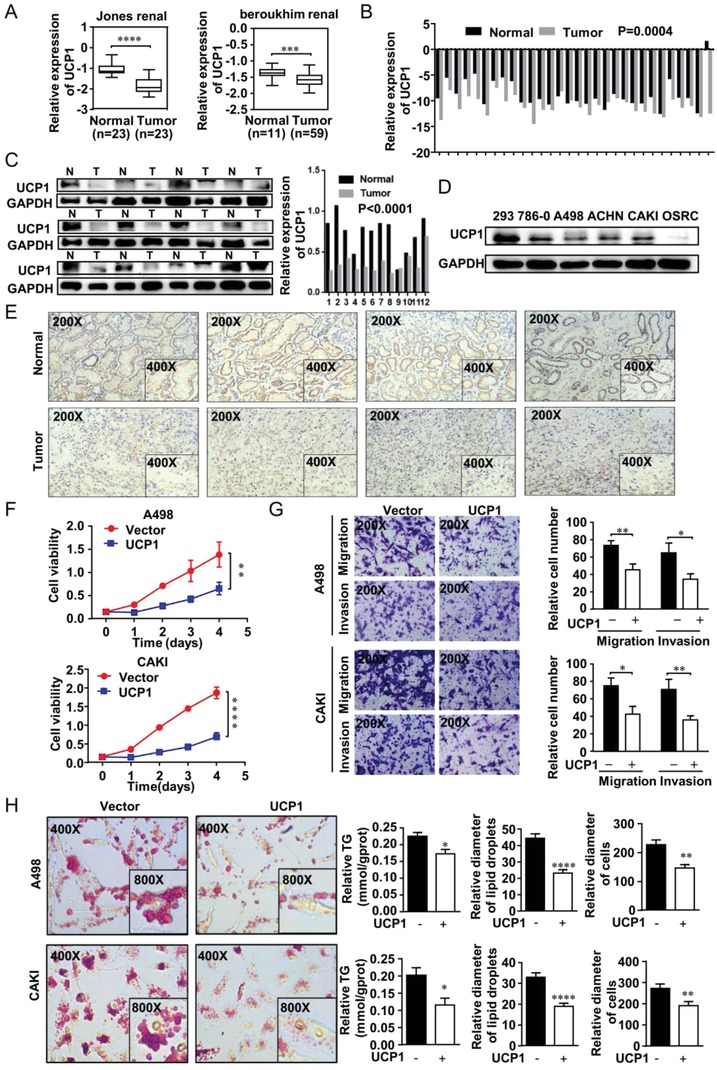
Figure 4.

UCP1 repressed ccRCC progression and promoted tumor cell “slimming” through lipid browning. A) The mRNA of UCP1 in two independent gene sets from the Oncomine database (https://www.oncomine.org) in ccRCC. B) The mRNA levels of UCP1 in 30 ccRCC tissues and adjacent nonmalignant tissues. t‐test, p = 0.0004. C,D) The protein levels of UCP1 in ccRCC tissues and cell lines including five ccRCC cell lines (786‐0, A498, ACHN, CAKI, and OSRC) and normal cell line (293) (Abbreviation: N, Normal tissue; T, Tumor tissue). E) Immunohistochemistry (IHC) staining for PLCL1 in ccRCC tissues and adjacent nonmalignant tissues. F) UCP1‐overexpressing cell lines were constructed by plasmid transfection with both A498 and CAKI. Cell growth curves of CCK8 assays for indicated cells. ****, p < 0.0001, **, p < 0.01. G) Migration and invasion assay for indicated ccRCC cells (Magnification: 200×). t‐test, **, p < 0.01, *, p < 0.05. H) Photomicrographs of Oil Red O staining of overexpressed UCP1 cell lines and its negative control (Magnification: 400× & 800×). Relative TG (mmol/gprot) tested by triglyceride assay kit. Relative diameters of lipid droplets and relative diameters of cells in the ccRCC cells described above. t‐test, ****, p < 0.0001, ***, p < 0.001, *, p < 0.05.
