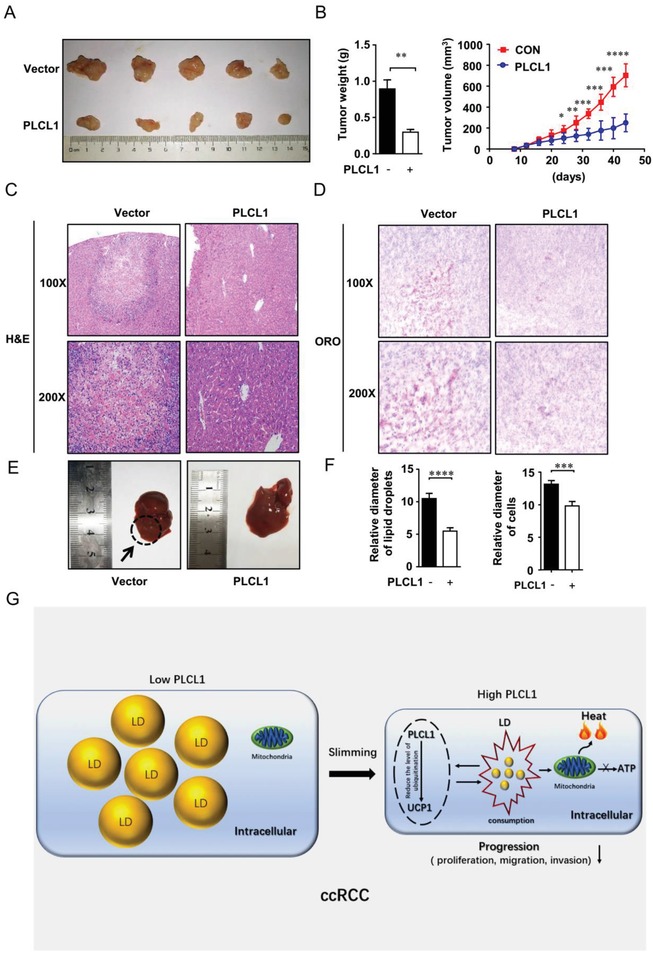
Figure 7.

PLCL1 repressed ccRCC progression and promoted tumor cell “slimming” in vivo. A,B) CAKI cells stably overexpressing of PLCL1 were injected into nude mice. Tumor size was measured every four days. The data are shown as the mean ± SEM for separate tumors of each group. Images of tumors dissected from the mice. The tumor size (mm3) was plotted against days post‐tumor cell implantation. Tumors were weighted after resection at the end of experiment. C) Hematoxylin‐eosin (H&E) staining of the livers in the PLCL1‐overexpressing and control groups (Magnification: 100× & 200×). D) Photomicrographs of Oil Red O staining of the tumor xenograft in PLCL1 overexpressed and control groups (Magnification: 100× & 200×). t‐test, ****, p < 0.0001, ***, p < 0.001. E) Photomicrographs of the livers in the PLCL1‐overexpressing and control groups. F) Relative diameters of lipid droplets and cells for the tumor xenograft. G) Proposed model illustrating the protective function of PLCL1 and UCP1‐mediated lipid browning in ccRCC.
