Figure 3.

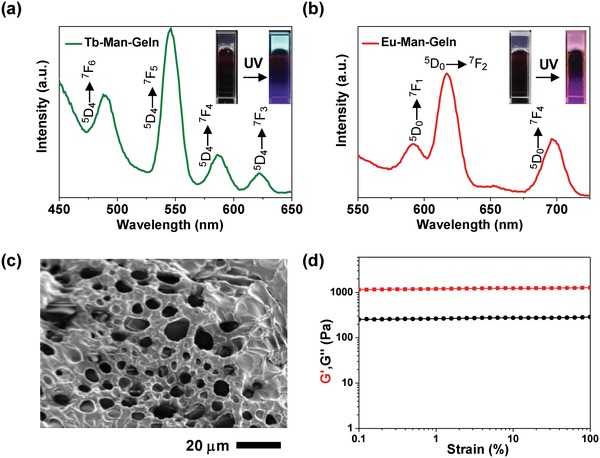
Ln–Man–Geln hydrogels. The fluorescent spectra and images of a) Tb–Man–Geln and b) Eu–Man–Geln hydrogels under daylight and UV light (312 nm). c) SEM image of Tb–Man‐Geln. d) The rheology properties of Tb–Man–Geln.

Ln–Man–Geln hydrogels. The fluorescent spectra and images of a) Tb–Man–Geln and b) Eu–Man–Geln hydrogels under daylight and UV light (312 nm). c) SEM image of Tb–Man‐Geln. d) The rheology properties of Tb–Man–Geln.