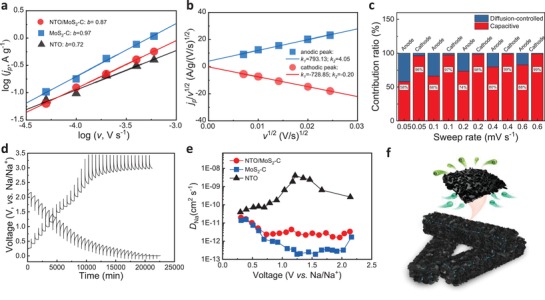
Figure 5.

Electrochemical mechanism analysis of NTO/MoS2‐C in SIBs. a) b values analysis, b) v 1/2–j p/v 1/2 plot analysis, c) contribution ratio of the capacitive and diffusion‐controlled currents versus scan rate. d) GITT curves and e) comparison of Na+ diffusion coefficient (D Na) calculated from the GITT curves among NTO/MoS2‐C, MoS2‐C and NTO electrodes. f) Schematic diagram of the fast Na+ transfer behaviors of NTO/MoS2‐C in SIBs.
