
Figure 5.
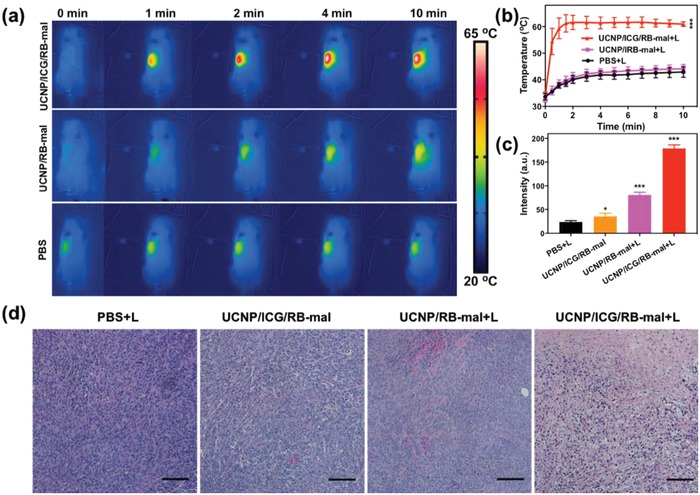
In vivo photothermal and photodynamic response. a) Infrared thermal images of 4T1‐tumor‐bearing mice injected with UCNP/ICG/RB‐mal, UCNP/RB‐mal, or PBS in response to 805 nm laser irradiation (10 min, 0.75W cm−2). b) The tumor temperature based on IR thermal imaging data in (a) (***P < 0.001 vs PBS + L). c) The ROS levels of 4T1 tumors injected with UCNP/ICG/RB‐mal, UCNP/RB‐mal, or PBS in response to 805 nm laser irradiation (10 min, 0.75 W cm−2; *P < 0.05 vs PBS + L group, ***P < 0.001 vs PBS + L group). d) Representative H&E‐stained images of 4T1 tumors after different treatments as indicated. Scale bar = 200 µm. Data are expressed as mean ± SD (n = 4).