
Figure 6.
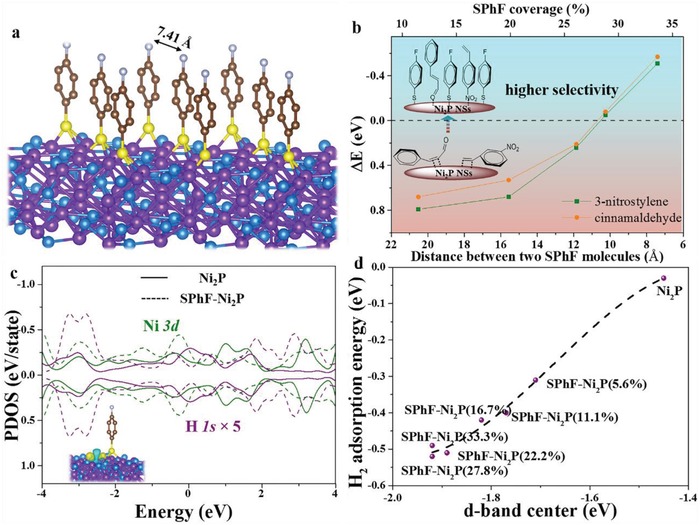
a) Constructed model of SPhF‐Ni2P surface (purple, blue, grown, yellow, and white represent Ni, P, C, S, and F, respectively); b) Adsorption exchange energy changes with the distance between two chelated SPhF molecules; c) PDOS plot of Ni3d and H1s orbitals in Ni2P and SPhF‐Ni2P (insert: differential charge density of H2 adsorbed on SPhF‐Ni2P interface, yellow and blue indicate electronic charge accumulation and depletion, respectively, with iso‐surface value of 0.008 eÅ−3); d) Relationship between H2 adsorption energy and d‐band center.