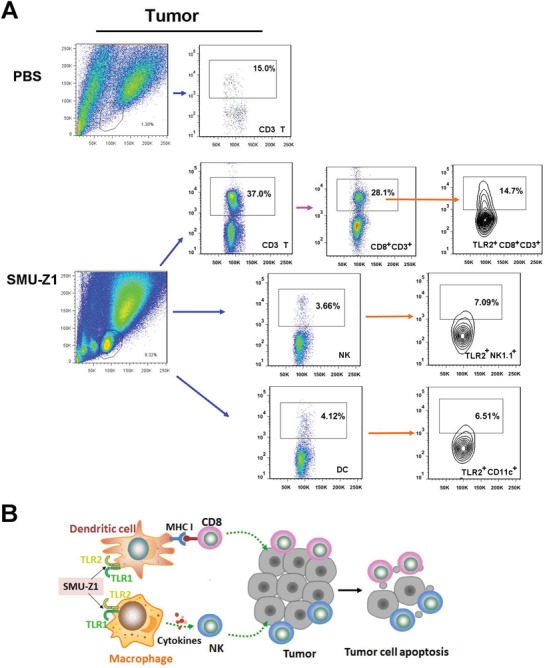
Figure 6.

SMU‐Z1 increases tumor infiltrating lymphocytes. A) Similar to experiment described in Figure 5, tumors were harvested on day 35 to isolate and analyze TILs. Representative flow graph shows frequency of each types of TILs in PBS or SMU‐Z1 treated groups, including CD3+ T, CD8+CD3+ T, CD4+CD3+ T, TLR2+CD8+CD3+, TLR2+CD4+CD3+, NK, TLR2+NK1.1+, DC, TLR2+CD11c+ cells. B) Model of key cellular events mediating the anti‐tumor effect of SMU‐Z1. All the results are representative of two independent experiments.
