
FIGURE 3.
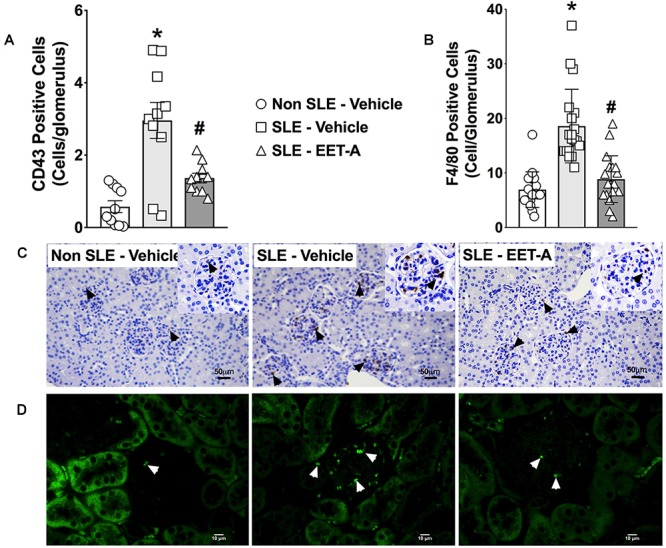
In a mouse model of systemic lupus erythematosus (SLE), EET-A reduced glomerular infiltration of CD43 positive immune cells (A) and F4/80 positive macrophages (B). Representative photomicrographs depicting CD43 positive (black arrows) immune cells (C) and F4/80 positive (white arrows) macrophages (D) in the glomeruli for the experimental groups. All data are expressed as Mean ± SEM, ∗P < 0.05 vs. Non SLE-Vehicle, #P < 0.05 vs. SLE-Vehicle, n = 10–12/group. NZBWF1 (SLE) and NZW/LacJ (Non SLE).