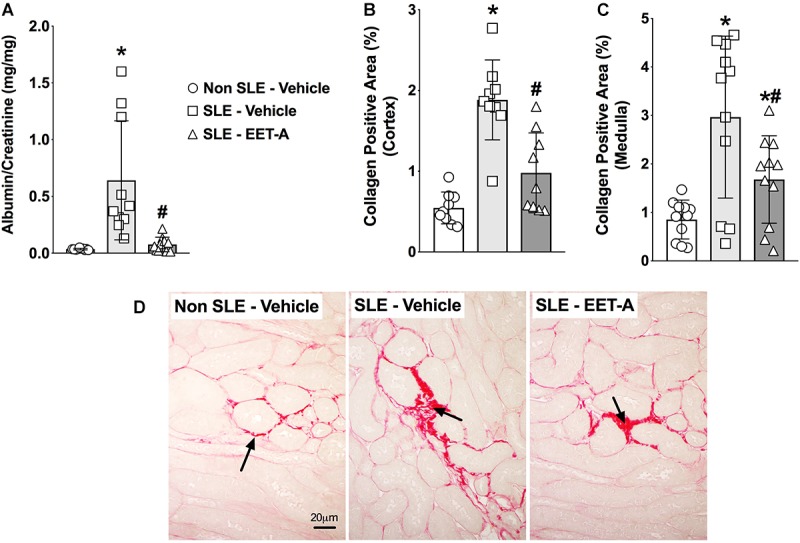
FIGURE 4.

EET-A decreased albuminuria (A) and reduced collagen positive fibrotic area in the renal cortex (B) and medulla (C) of a mouse model of systemic lupus erythematosus (SLE). A representative photomicrograph depicting collagen positive fibrotic areas in the kidney for the experimental groups (D). The black arrows showing collagen positive fibrotic areas in the kidney. All data are expressed as Mean ± SEM, ∗P < 0.05 vs. Non SLE-Vehicle, #P < 0.05 vs. SLE-Vehicle, n = 10–12/group. NZBWF1 (SLE) and NZW/LacJ (Non SLE).
