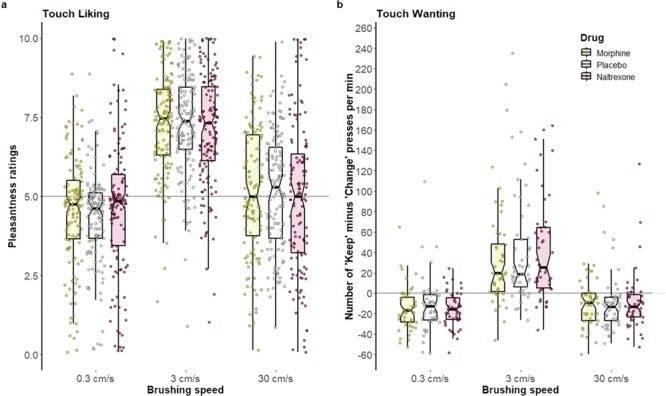
Fig. 4.

Touch liking and wanting. Notched box plots with scatter plots for (a) pleasantness ratings, and (b) ‘wanting’ scores; horizontal axes set at neutral pleasantness (5) and neutral ‘wanting’ (0). Scatter plot points represent individual raw data points. A random horizontal jitter has been added to enable viewing of all points. For box plots, the lower and upper hinges correspond to the first and third quartiles (the 25th and 75th percentiles). The lower and upper whiskers extend to the smallest and largest values, respectively, no further than 1.5 times the inter-quartile range, which is the distance between the first and third quartiles. The median is indicated by a black band across the boxes, with notches indicating a 95% confidence interval for the median. Non-overlapping notches indicate statistically significant differences at roughly the 95% level (Mcgill et al., 1978). There was a statistically significant main effect of brushing speed on (a) and (b) . There were no statistically significant effects of, or interactions with, drug on (a) or (b) at any level of brushing speed (0.3, 3 and 30 cm/s).
