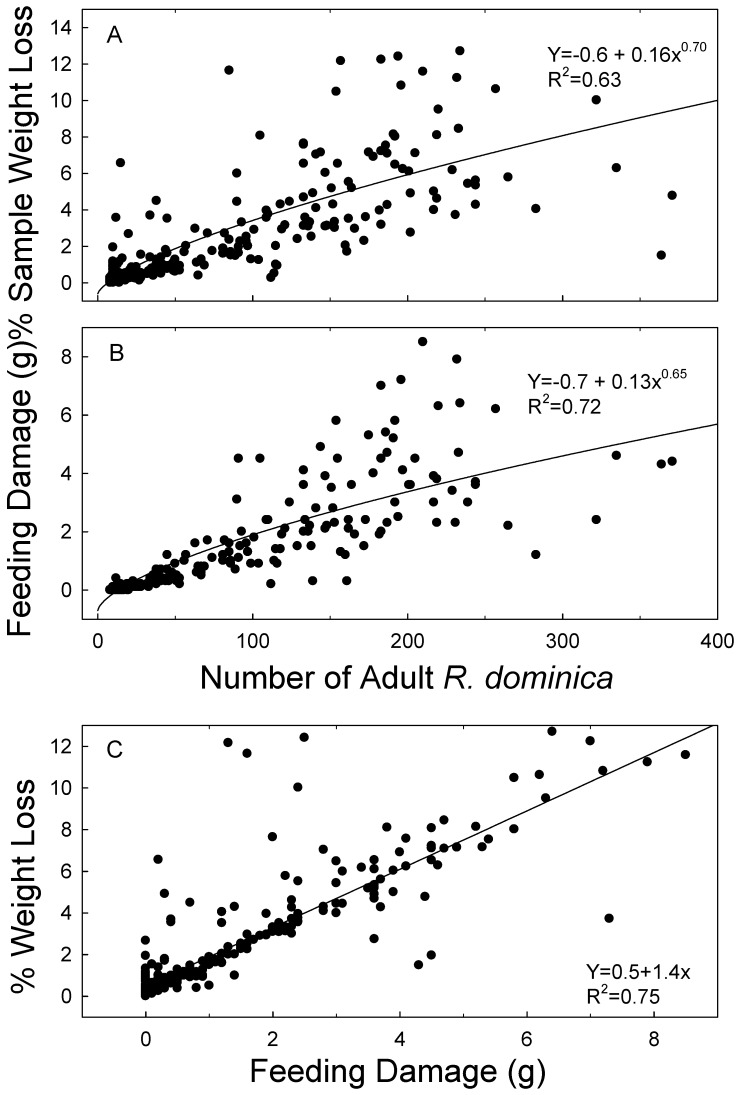
Figure 3.
Equations and R2 values for percentage of sample weight loss (A) and feeding damage (B) with respect to adult progeny of R. dominica, and equation and R2 values for sample weight loss (y axis) and feeding damage (x axis) (C). The data plotted are all data collected for R. dominica over 15 months.

